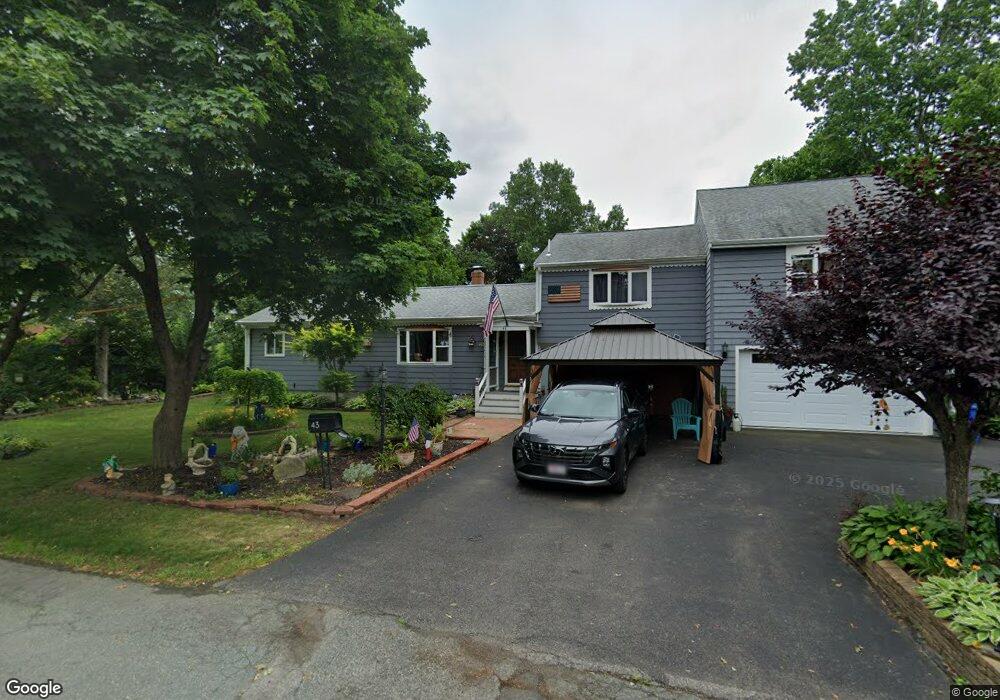
43 O Brien Ave Whitman, MA 02382
Whitman AreaEstimated Value: $536,000 - $633,000
About This Home
This home is located at 43 O Brien Ave, Whitman, MA 02382 and is currently estimated at $587,784, approximately $238 per square foot. 43 O Brien Ave is a home located in Plymouth County with nearby schools including St Bridget School.
Ownership History
We collect this data history from publicly available records. To have your information removed, we recommend requesting removal directly through your county’s website.
Purchase Details
Home Values in the Area
Average Home Value in this Area
Purchase History
We collect this data history from publicly available records. To have your information removed, we recommend requesting removal directly through your county’s website.
| Date | Buyer | Sale Price | Title Company |
|---|---|---|---|
| $95,000 | -- |
Mortgage History
We collect this data history from publicly available records. To have your information removed, we recommend requesting removal directly through your county’s website.
| Date | Status | Borrower | Loan Amount |
|---|---|---|---|
| Closed | $100,000 | ||
| Closed | $110,000 | ||
| Closed | $125,000 | ||
| Closed | $26,000 | ||
| Closed | $97,600 | ||
| Closed | $12,000 | ||
| Closed | $100,000 | ||
| Previous Owner | $50,000 |
Tax History
We collect this data history from publicly available records. To have your information removed, we recommend requesting removal directly through your county’s website.
| Year | Tax Paid | Tax Assessment Tax Assessment Total Assessment is a certain percentage of the fair market value that is determined by local assessors to be the total taxable value of land and additions on the property. | Land | Improvement |
|---|---|---|---|---|
| 2025 | $5,518 | $420,600 | $213,100 | $207,500 |
| 2024 | $5,113 | $401,300 | $209,000 | $192,300 |
| 2023 | $4,733 | $348,800 | $181,200 | $167,600 |
| 2022 | $4,652 | $319,500 | $164,700 | $154,800 |
| 2021 | $4,762 | $307,200 | $151,300 | $155,900 |
| 2020 | $4,641 | $292,800 | $136,900 | $155,900 |
| 2019 | $4,328 | $281,400 | $136,900 | $144,500 |
| 2018 | $3,924 | $245,100 | $129,700 | $115,400 |
| 2017 | $3,696 | $245,100 | $129,700 | $115,400 |
| 2016 | $3,679 | $236,000 | $123,500 | $112,500 |
| 2015 | $3,554 | $227,700 | $123,500 | $104,200 |
Map
- 300 High St
- 603 Temple St
- 90 Loring Ave
- 646 Bedford St Unit C1
- 200 Temple St
- 360 High St
- 1 Paradise Ln Unit I1
- 1 Paradise Ln Unit C3
- 751 Washington St
- 1012 Washington St
- 659 Washington St
- 534 Hogg Memorial Dr
- 62 Clapp St
- 501 Auburn St Unit 502
- 501 Auburn St Unit 406
- 55 Clapp St
- 71 Sportsmans Trail
- 1121 Washington St
- 87 Burton Ave
- 15 Russell Rd
Ask me questions while you tour the home.