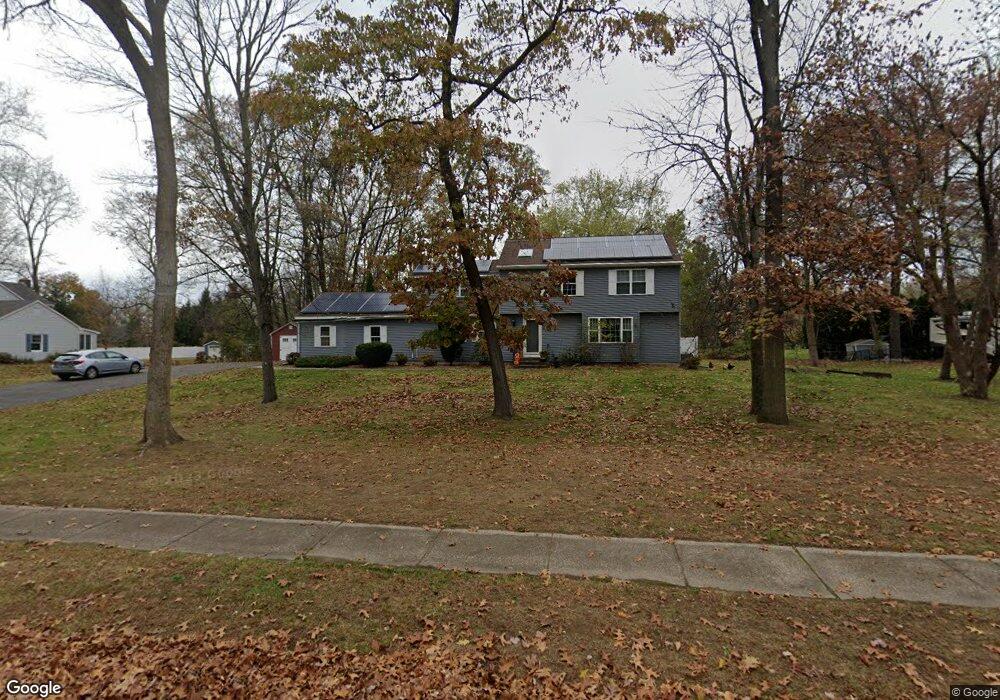
43 Oxbow Ln South Windsor, CT 06074
South Windsor AreaEstimated Value: $551,000 - $645,341
About This Home
This home is located at 43 Oxbow Ln, South Windsor, CT 06074 and is currently estimated at $601,835, approximately $246 per square foot. 43 Oxbow Ln is a home located in Hartford County with nearby schools including Timothy Edwards School and South Windsor High School.
Ownership History
We collect this data history from publicly available records. To have your information removed, we recommend requesting removal directly through your county’s website.
Purchase Details
Home Values in the Area
Average Home Value in this Area
Purchase History
We collect this data history from publicly available records. To have your information removed, we recommend requesting removal directly through your county’s website.
| Date | Buyer | Sale Price | Title Company |
|---|---|---|---|
| $330,000 | -- |
Mortgage History
We collect this data history from publicly available records. To have your information removed, we recommend requesting removal directly through your county’s website.
| Date | Status | Borrower | Loan Amount |
|---|---|---|---|
| Closed | $48,000 | ||
| Previous Owner | $120,606 | ||
| Previous Owner | $79,000 | ||
| Previous Owner | $285,000 | ||
| Previous Owner | $276,000 | ||
| Previous Owner | $50,000 | ||
| Previous Owner | $223,200 |
Tax History
We collect this data history from publicly available records. To have your information removed, we recommend requesting removal directly through your county’s website.
| Year | Tax Paid | Tax Assessment Tax Assessment Total Assessment is a certain percentage of the fair market value that is determined by local assessors to be the total taxable value of land and additions on the property. | Land | Improvement |
|---|---|---|---|---|
| 2025 | $12,157 | $341,400 | $130,200 | $211,200 |
| 2024 | $11,765 | $341,400 | $130,200 | $211,200 |
| 2023 | $11,314 | $341,400 | $130,200 | $211,200 |
| 2022 | $10,534 | $271,700 | $130,200 | $141,500 |
| 2021 | $10,287 | $271,700 | $130,200 | $141,500 |
| 2020 | $10,182 | $268,800 | $130,200 | $138,600 |
| 2019 | $10,349 | $268,800 | $130,200 | $138,600 |
| 2018 | $10,126 | $268,800 | $130,200 | $138,600 |
| 2017 | $10,651 | $279,700 | $146,500 | $133,200 |
| 2016 | $10,444 | $279,700 | $146,500 | $133,200 |
| 2015 | $10,220 | $279,700 | $146,500 | $133,200 |
| 2014 | $9,932 | $279,700 | $146,500 | $133,200 |
Map
- 1653 Main St
- 1689 Main St
- 1742 Main St
- 14 Fitch Meadow Ln Unit 14
- 294 S Main St Unit LOT 18
- 294 S Main St Unit LOT 32A
- 724 Strong Rd
- 12 W River Rd
- 29 W River Rd
- 27 W River Rd
- 24 Cathy (Lot 14) Ln
- 20 Cathy (Lot 16) Ln
- 22 Cathy (Lot 15) Ln
- 18 Cathy (Lot 17) Ln
- 23 Cathy (Lot 21) Ln
- 21 Ln
- 17 Cathy (Lot 18) Ln
- 951 Main St
- 176 Newberry Rd
- 299 Palisado Ave
Ask me questions while you tour the home.