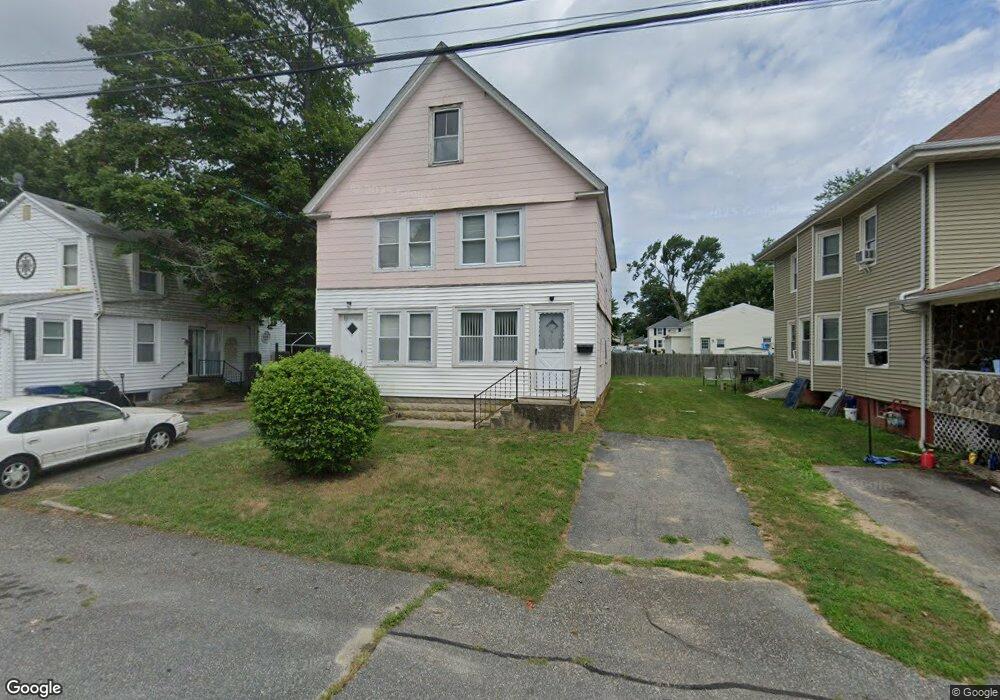
43 Royal Ave Warwick, RI 02889
Conimicut-Shawomet NeighborhoodEstimated Value: $440,062 - $552,000
About This Home
This home is located at 43 Royal Ave, Warwick, RI 02889 and is currently estimated at $502,016, approximately $232 per square foot. 43 Royal Ave is a home located in Kent County with nearby schools including Saint Kevin School and Bishop Hendricken High School.
Ownership History
We collect this data history from publicly available records. To have your information removed, we recommend requesting removal directly through your county’s website.
Purchase Details
Home Values in the Area
Average Home Value in this Area
Purchase History
We collect this data history from publicly available records. To have your information removed, we recommend requesting removal directly through your county’s website.
| Date | Buyer | Sale Price | Title Company |
|---|---|---|---|
| $100,000 | -- |
Tax History
We collect this data history from publicly available records. To have your information removed, we recommend requesting removal directly through your county’s website.
| Year | Tax Paid | Tax Assessment Tax Assessment Total Assessment is a certain percentage of the fair market value that is determined by local assessors to be the total taxable value of land and additions on the property. | Land | Improvement |
|---|---|---|---|---|
| 2025 | $4,234 | $333,400 | $111,100 | $222,300 |
| 2024 | $4,007 | $276,900 | $96,600 | $180,300 |
| 2023 | $3,929 | $276,900 | $96,600 | $180,300 |
| 2022 | $3,504 | $187,100 | $59,400 | $127,700 |
| 2021 | $3,504 | $187,100 | $59,400 | $127,700 |
| 2020 | $3,504 | $187,100 | $59,400 | $127,700 |
| 2019 | $3,504 | $187,100 | $59,400 | $127,700 |
| 2018 | $3,035 | $145,900 | $59,400 | $86,500 |
| 2017 | $2,953 | $145,900 | $59,400 | $86,500 |
| 2016 | $2,953 | $145,900 | $59,400 | $86,500 |
| 2015 | $2,561 | $123,400 | $53,200 | $70,200 |
| 2014 | $2,475 | $123,400 | $53,200 | $70,200 |
| 2013 | $2,442 | $123,400 | $53,200 | $70,200 |
Map
- 16 Allard St
- 600 Cole Farm Rd
- 116 Ardway Ave
- 269 Bellman Ave
- 15 Sarah Teft Dr
- 325 Church Ave
- 139 Overbrook Ave
- 88 Glenbrook Rd
- 118 Foxcroft Ave
- 43 New Britain Dr
- 57 Mckay Ct
- 56 Mckay Ct
- 69 Namquid Dr
- 20 Killey Ave
- 301 W Shore Rd Unit 19
- 80 Killey Ave
- 135 Namquid Dr
- 179 Lane 4
- 97 Delwood Rd
- 256 Point Ave
Ask me questions while you tour the home.