43 S 3rd St Ship Bottom, NJ 08008
Long Beach Island NeighborhoodEstimated Value: $911,000 - $1,747,000
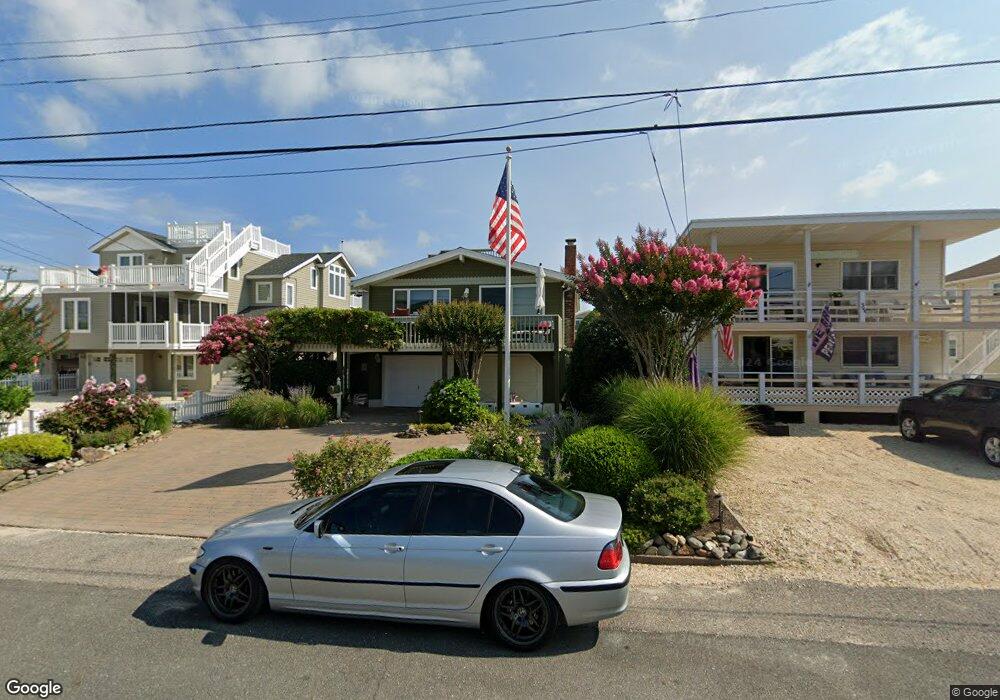
About This Home
This home is located at 43 S 3rd St, Ship Bottom, NJ 08008 and is currently estimated at $1,211,533, approximately $1,201 per square foot. 43 S 3rd St is a home located in Ocean County with nearby schools including Ethel A. Jacobsen Elementary School, Long Beach Island Grade School, and Southern Regional Middle School.
Ownership History
We collect this data history from publicly available records. To have your information removed, we recommend requesting removal directly through your county’s website.
Purchase Details
Home Financials for this Owner
Home Financials are based on the most recent Mortgage that was taken out on this home.Purchase Details
Home Values in the Area
Average Home Value in this Area
Purchase History
We collect this data history from publicly available records. To have your information removed, we recommend requesting removal directly through your county’s website.
| Date | Buyer | Sale Price | Title Company |
|---|---|---|---|
| $875,000 | Chicago Title Insurance Compan | ||
| $175,000 | -- |
Mortgage History
We collect this data history from publicly available records. To have your information removed, we recommend requesting removal directly through your county’s website.
| Date | Status | Borrower | Loan Amount |
|---|---|---|---|
| Open | $700,000 |
Tax History
We collect this data history from publicly available records. To have your information removed, we recommend requesting removal directly through your county’s website.
| Year | Tax Paid | Tax Assessment Tax Assessment Total Assessment is a certain percentage of the fair market value that is determined by local assessors to be the total taxable value of land and additions on the property. | Land | Improvement |
|---|---|---|---|---|
| 2025 | $9,575 | $898,200 | $700,000 | $198,200 |
| 2024 | $9,027 | $898,200 | $700,000 | $198,200 |
| 2023 | $8,802 | $898,200 | $700,000 | $198,200 |
| 2022 | $8,802 | $898,200 | $700,000 | $198,200 |
| 2021 | $8,102 | $898,200 | $700,000 | $198,200 |
| 2020 | $7,841 | $898,200 | $700,000 | $198,200 |
| 2019 | $7,811 | $896,800 | $700,000 | $196,800 |
| 2018 | $6,928 | $682,600 | $552,000 | $130,600 |
| 2017 | $7,017 | $682,600 | $552,000 | $130,600 |
| 2016 | $6,846 | $682,600 | $552,000 | $130,600 |
| 2015 | $6,567 | $682,600 | $552,000 | $130,600 |
| 2014 | $6,532 | $682,600 | $552,000 | $130,600 |
Map
- 46 S 2nd St
- 22 S 1st St
- 310 Central Ave
- 401 Boulevard Unit 306
- 401 Boulevard Unit 405
- 401 Boulevard Unit 207
- 10-A Long Beach Blvd
- 229 S 2nd St
- 274 S 1st St
- 30 N 3rd St
- 218 W 7th St
- 262 N 1st St
- 6 N 4th St
- 326 S 2nd St
- 108 W 10th St
- 212 N Barnegat Ave
- 331 N 2nd St
- 213 W 13th St
- 108 Shore Rd
- 233 N 7th St
Ask me questions while you tour the home.