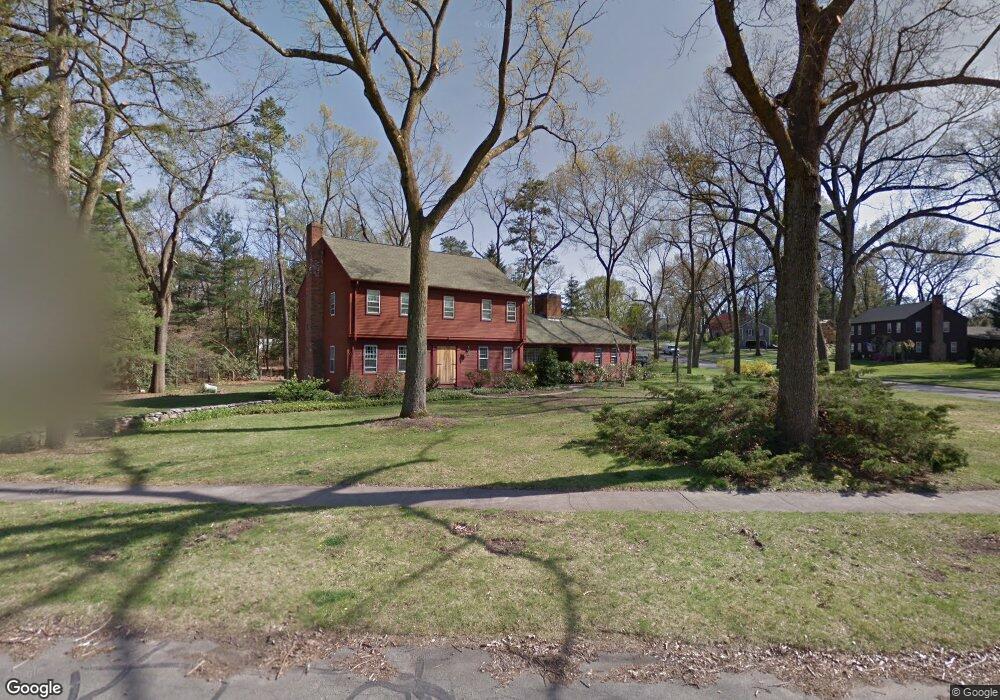
43 Salem Rd Longmeadow, MA 01106
Estimated Value: $688,683 - $757,000
About This Home
This home is located at 43 Salem Rd, Longmeadow, MA 01106 and is currently estimated at $720,894, approximately $275 per square foot. 43 Salem Rd is a home located in Hampden County with nearby schools including Blueberry Hill, Williams Middle School, and Longmeadow High School.
Ownership History
We collect this data history from publicly available records. To have your information removed, we recommend requesting removal directly through your county’s website.
Purchase Details
Home Financials for this Owner
Home Financials are based on the most recent Mortgage that was taken out on this home.Purchase Details
Purchase Details
Home Values in the Area
Average Home Value in this Area
Purchase History
We collect this data history from publicly available records. To have your information removed, we recommend requesting removal directly through your county’s website.
| Date | Buyer | Sale Price | Title Company |
|---|---|---|---|
| $375,000 | -- | ||
| $290,000 | -- | ||
| -- | -- |
Mortgage History
We collect this data history from publicly available records. To have your information removed, we recommend requesting removal directly through your county’s website.
| Date | Status | Borrower | Loan Amount |
|---|---|---|---|
| Open | $484,350 |
Tax History
We collect this data history from publicly available records. To have your information removed, we recommend requesting removal directly through your county’s website.
| Year | Tax Paid | Tax Assessment Tax Assessment Total Assessment is a certain percentage of the fair market value that is determined by local assessors to be the total taxable value of land and additions on the property. | Land | Improvement |
|---|---|---|---|---|
| 2025 | $12,292 | $582,000 | $224,100 | $357,900 |
| 2024 | $12,036 | $582,000 | $224,100 | $357,900 |
| 2023 | $11,277 | $492,000 | $174,700 | $317,300 |
| 2022 | $11,083 | $449,800 | $182,400 | $267,400 |
| 2021 | $10,853 | $438,700 | $181,300 | $257,400 |
| 2020 | $8,904 | $367,800 | $196,600 | $171,200 |
| 2019 | $9,850 | $408,900 | $196,600 | $212,300 |
| 2018 | $9,195 | $378,200 | $211,700 | $166,500 |
| 2017 | $8,918 | $378,200 | $211,700 | $166,500 |
| 2016 | $8,618 | $354,200 | $197,700 | $156,500 |
| 2015 | $8,319 | $352,200 | $195,700 | $156,500 |
Map
- 186 Tanglewood Dr
- 435 Converse St
- 38 Oxford Rd
- 608 Pinewood Dr
- 164 Farmington Rd
- 535 Converse St
- 141 Ellington St
- 165 Converse St Unit 1
- 124 Westmoreland Ave
- 252 Pinewood Dr
- 19 Harwich Rd
- 107 Viscount Rd
- 42 Elizabeth Cir
- 169 Greenacre Ave
- 70 Dover Rd
- 33 Highland St
- 117 Hopkins Place
- 99 Birchwood Ave
- 158 Wenonah Rd
- 40 Yorktown Dr Unit D
Ask me questions while you tour the home.