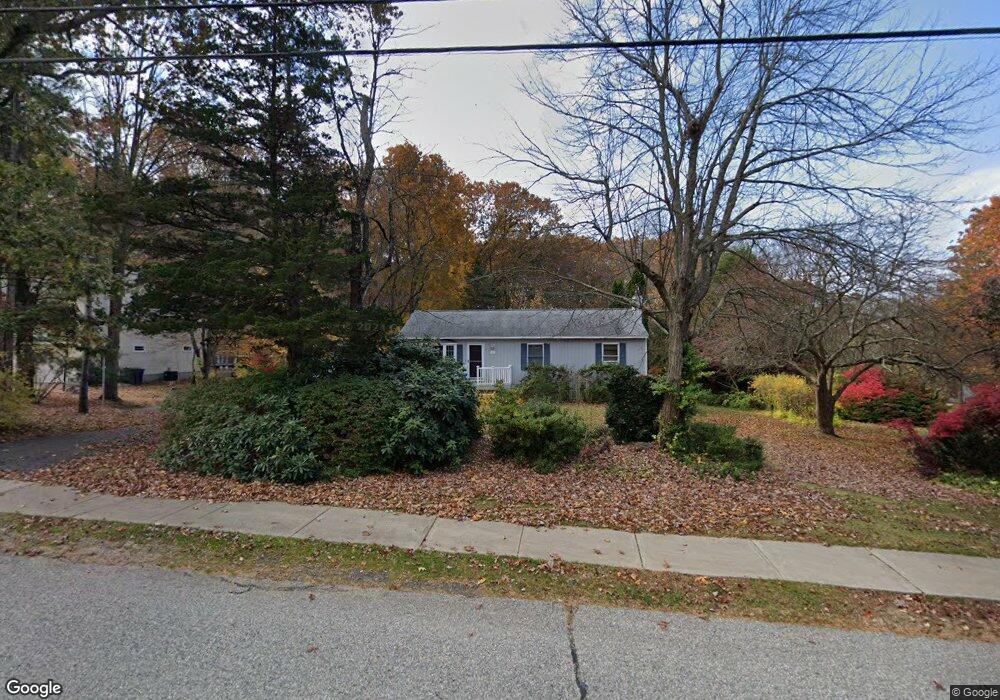
43 Smith St East Hampton, CT 06424
East Hampton AreaEstimated Value: $364,434 - $369,000
About This Home
This home is located at 43 Smith St, East Hampton, CT 06424 and is currently estimated at $367,109, approximately $306 per square foot. 43 Smith St is a home located in Middlesex County with nearby schools including Memorial School, Center Elementary School, and East Hampton Middle School.
Ownership History
We collect this data history from publicly available records. To have your information removed, we recommend requesting removal directly through your county’s website.
Purchase Details
Home Values in the Area
Average Home Value in this Area
Purchase History
We collect this data history from publicly available records. To have your information removed, we recommend requesting removal directly through your county’s website.
| Date | Buyer | Sale Price | Title Company |
|---|---|---|---|
| $44,000 | -- |
Tax History
We collect this data history from publicly available records. To have your information removed, we recommend requesting removal directly through your county’s website.
| Year | Tax Paid | Tax Assessment Tax Assessment Total Assessment is a certain percentage of the fair market value that is determined by local assessors to be the total taxable value of land and additions on the property. | Land | Improvement |
|---|---|---|---|---|
| 2025 | $5,116 | $128,830 | $43,740 | $85,090 |
| 2024 | $4,901 | $128,830 | $43,740 | $85,090 |
| 2023 | $4,646 | $128,830 | $43,740 | $85,090 |
| 2022 | $4,465 | $128,820 | $43,730 | $85,090 |
| 2021 | $4,448 | $128,820 | $43,730 | $85,090 |
| 2020 | $4,374 | $132,000 | $42,970 | $89,030 |
| 2019 | $4,527 | $136,600 | $46,040 | $90,560 |
| 2018 | $4,278 | $136,600 | $46,040 | $90,560 |
| 2017 | $4,278 | $136,600 | $46,040 | $90,560 |
| 2016 | $4,022 | $136,600 | $46,040 | $90,560 |
| 2015 | $4,124 | $148,470 | $58,670 | $89,800 |
| 2014 | $3,589 | $148,470 | $58,670 | $89,800 |
Map
- 21 Sunset Dr
- 25 1/2 Edgerton St
- 22 Viola Dr
- 58 Royal Oaks Ave
- 119 Main St
- 124 Main St
- 126 Main St
- 82 Main St
- 17 Pecausett Trail
- 27 Bevin Blvd
- 159 Bear Swamp Rd
- 14 Main St
- 24 W Point Rd
- 9A-2 Flatbrook Rd
- 102 Lake Vista Dr Unit 102
- 606 Lake Vista Dr Unit 606
- 201 Edgewater Cir Unit B
- 235 Middle Haddam Rd
- 16 Tall Wood Dr
- 165 Colchester Ave
Ask me questions while you tour the home.