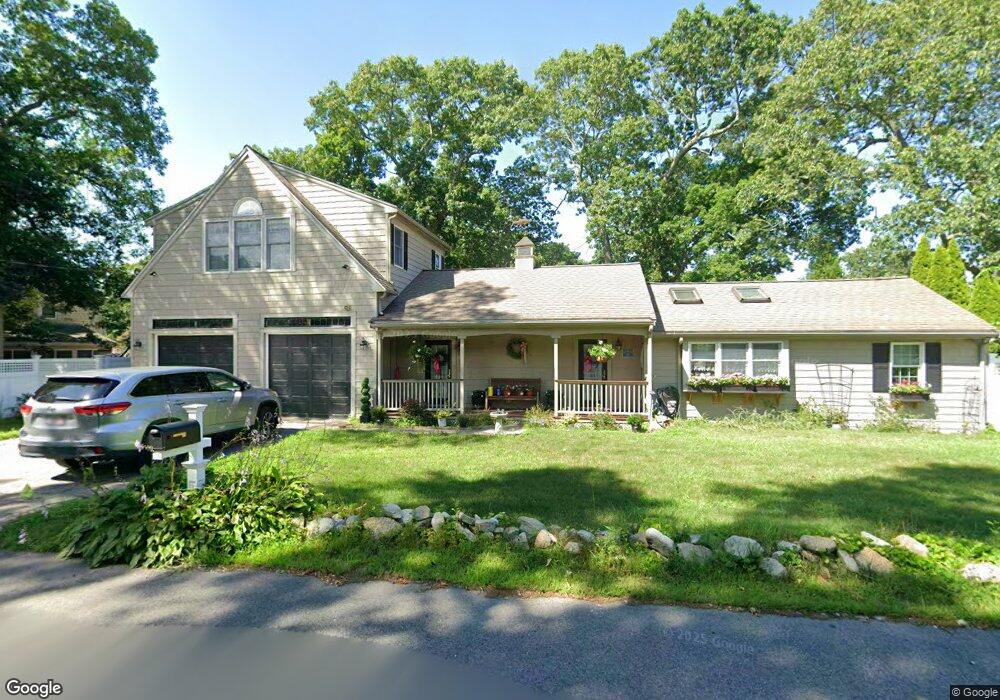
43 Temple Rd Marshfield, MA 02050
Green Harbor-Cedar Crest NeighborhoodEstimated Value: $638,000 - $800,000
3
Beds
2
Baths
2,040
Sq Ft
$353/Sq Ft
Est. Value
About This Home
This home is located at 43 Temple Rd, Marshfield, MA 02050 and is currently estimated at $720,356, approximately $353 per square foot. 43 Temple Rd is a home located in Plymouth County with nearby schools including Governor Edward Winslow School, Furnace Brook Middle School, and Marshfield High School.
Ownership History
Date
Name
Owned For
Owner Type
Purchase Details
Closed on
Mar 30, 2009
Sold by
Creed Kathleen M
Bought by
Svizzero Kathleen M
Current Estimated Value
Home Financials for this Owner
Home Financials are based on the most recent Mortgage that was taken out on this home.
Original Mortgage
$157,000
Interest Rate
5.14%
Mortgage Type
Purchase Money Mortgage
Purchase Details
Closed on
Oct 31, 1988
Sold by
Meech Eric G
Bought by
Creed Kathleen M
Create a Home Valuation Report for This Property
The Home Valuation Report is an in-depth analysis detailing your home's value as well as a comparison with similar homes in the area
Home Values in the Area
Average Home Value in this Area
Purchase History
| Date | Buyer | Sale Price | Title Company |
|---|---|---|---|
| Svizzero Kathleen M | -- | -- | |
| Svizzero Kathleen M | -- | -- | |
| Creed Kathleen M | $110,000 | -- |
Source: Public Records
Mortgage History
| Date | Status | Borrower | Loan Amount |
|---|---|---|---|
| Open | Creed Kathleen M | $200,000 | |
| Closed | Creed Kathleen M | $157,000 |
Source: Public Records
Tax History
| Year | Tax Paid | Tax Assessment Tax Assessment Total Assessment is a certain percentage of the fair market value that is determined by local assessors to be the total taxable value of land and additions on the property. | Land | Improvement |
|---|---|---|---|---|
| 2025 | $5,659 | $571,600 | $261,300 | $310,300 |
| 2024 | $5,533 | $532,500 | $251,300 | $281,200 |
| 2023 | $5,469 | $489,700 | $231,200 | $258,500 |
| 2022 | $5,469 | $422,300 | $201,000 | $221,300 |
| 2021 | $5,345 | $405,200 | $201,000 | $204,200 |
| 2020 | $5,217 | $391,400 | $191,000 | $200,400 |
| 2019 | $4,956 | $370,400 | $191,000 | $179,400 |
| 2018 | $4,183 | $312,900 | $191,000 | $121,900 |
| 2017 | $4,034 | $294,000 | $180,900 | $113,100 |
| 2016 | $3,934 | $283,400 | $180,900 | $102,500 |
| 2015 | $3,660 | $275,400 | $180,900 | $94,500 |
| 2014 | $3,608 | $271,500 | $180,900 | $90,600 |
Source: Public Records
Map
Nearby Homes
- 245 Careswell St
- 56 Lincoln Ave
- 238 Atwell Cir
- 585 Careswell St
- 98 Cherry St
- 68 Leland Rd
- 36 Ocean Rd N
- 72 Pilgrim Trail
- 13 Lewis Ct
- 130 Winslow Cemetery Rd
- 308 Ocean St
- 99 Ashburton Ave
- 95 Blackmount Dr
- 51 Meetinghouse Ln
- 555 Webster St
- 1221 Ocean St
- 39 Bay Pond Rd
- 1 John St
- 42 Carr Rd
- 45 Red Gold Farm Rd
Your Personal Tour Guide
Ask me questions while you tour the home.