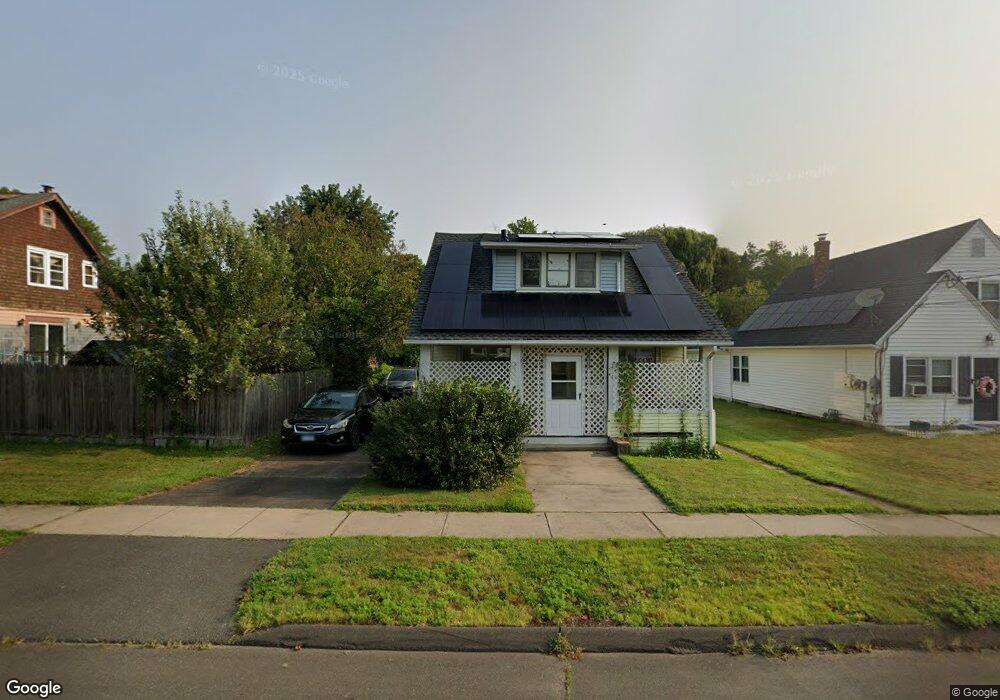
43 Whiton St Windsor Locks, CT 06096
Estimated Value: $256,000 - $290,691
About This Home
This home is located at 43 Whiton St, Windsor Locks, CT 06096 and is currently estimated at $276,423, approximately $248 per square foot. 43 Whiton St is a home located in Hartford County with nearby schools including North Street School, South Elementary School, and Windsor Locks Middle School.
Ownership History
We collect this data history from publicly available records. To have your information removed, we recommend requesting removal directly through your county’s website.
Purchase Details
Home Financials for this Owner
Home Financials are based on the most recent Mortgage that was taken out on this home.Home Values in the Area
Average Home Value in this Area
Purchase History
We collect this data history from publicly available records. To have your information removed, we recommend requesting removal directly through your county’s website.
| Date | Buyer | Sale Price | Title Company |
|---|---|---|---|
| $61,000 | -- |
Mortgage History
We collect this data history from publicly available records. To have your information removed, we recommend requesting removal directly through your county’s website.
| Date | Status | Borrower | Loan Amount |
|---|---|---|---|
| Open | $90,300 | ||
| Closed | $91,000 | ||
| Closed | $64,400 | ||
| Previous Owner | $65,000 |
Tax History
We collect this data history from publicly available records. To have your information removed, we recommend requesting removal directly through your county’s website.
| Year | Tax Paid | Tax Assessment Tax Assessment Total Assessment is a certain percentage of the fair market value that is determined by local assessors to be the total taxable value of land and additions on the property. | Land | Improvement |
|---|---|---|---|---|
| 2025 | $3,757 | $156,590 | $50,680 | $105,910 |
| 2024 | $2,738 | $97,300 | $32,760 | $64,540 |
| 2023 | $2,562 | $97,300 | $32,760 | $64,540 |
| 2022 | $2,513 | $97,300 | $32,760 | $64,540 |
| 2021 | $2,513 | $97,300 | $32,760 | $64,540 |
| 2020 | $2,513 | $97,300 | $32,760 | $64,540 |
| 2019 | $2,513 | $97,300 | $32,760 | $64,540 |
| 2017 | $2,349 | $88,100 | $31,900 | $56,200 |
| 2016 | $2,349 | $88,100 | $31,900 | $56,200 |
| 2015 | $2,360 | $88,100 | $31,900 | $56,200 |
| 2014 | $2,683 | $102,300 | $36,200 | $66,100 |
Map
- 8 James St
- 6 James St
- 235 Reed Ave
- 21 Birge Ave
- 7 Cannon St
- 15 Suffield St
- 50 Chapman Chase Unit 50
- 66 Woodcock Ct Unit 66
- 33 Thomas St
- 10 Center St
- 13 Jubrey Ln
- 23 Ellis St
- 39 Chapman Chase
- 134 Sunset St
- 20 Sherwin Ln
- 27 Highland Rd
- 223 Spring St
- 0 N Water St Unit 24138494
- 0 N Water St Unit 24128295
- 0 N Water St Unit 24128294
Ask me questions while you tour the home.