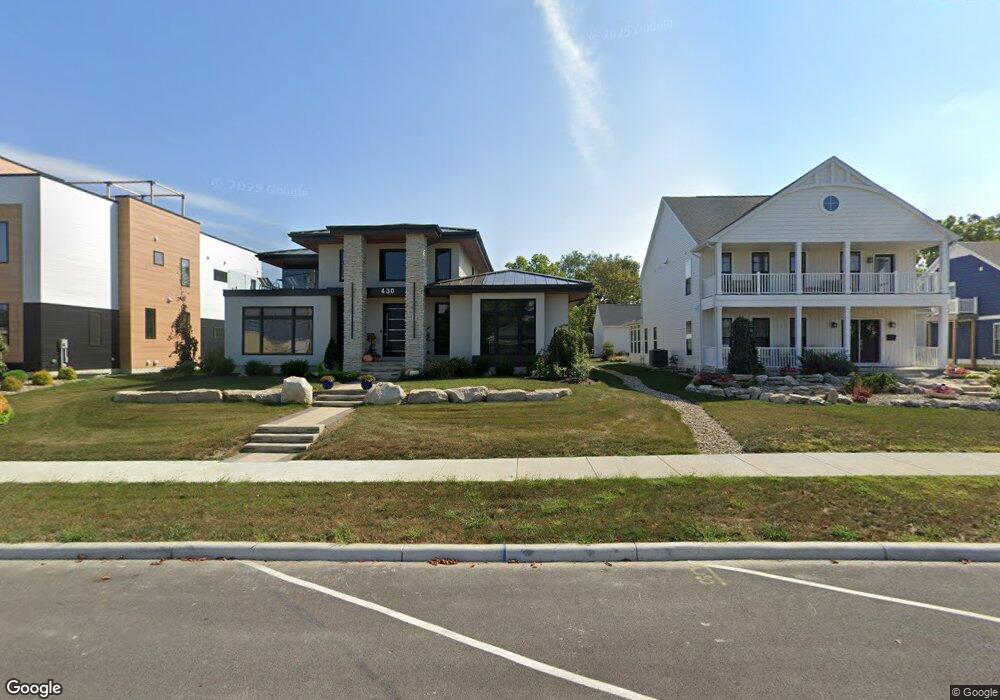
430 E Market St Sandusky, OH 44870
Estimated Value: $187,000 - $778,000
4
Beds
4
Baths
4,534
Sq Ft
$111/Sq Ft
Est. Value
About This Home
This home is located at 430 E Market St, Sandusky, OH 44870 and is currently estimated at $502,742, approximately $110 per square foot. 430 E Market St is a home with nearby schools including Sandusky High School, Monroe Preparatory Academy, and Sandusky Central Catholic School.
Ownership History
Date
Name
Owned For
Owner Type
Purchase Details
Closed on
Feb 12, 2025
Sold by
Torres Eduardo H and Torres Jennifer L
Bought by
Jennifer L Torres Revocable Trust and Eduardo H Torres Jr Revocable Trust
Current Estimated Value
Purchase Details
Closed on
Aug 31, 2021
Sold by
City Of Sandusky
Bought by
Torres Eduardo H and Torres Jenifer L
Home Financials for this Owner
Home Financials are based on the most recent Mortgage that was taken out on this home.
Original Mortgage
$693,500
Interest Rate
2.75%
Mortgage Type
Construction
Purchase Details
Closed on
Nov 12, 2020
Sold by
City Of Sandusky
Bought by
City Of Sandusky
Purchase Details
Closed on
Jun 1, 2009
Sold by
Bay Area Neighborhood Development Corpor
Bought by
City Of Sandusky
Create a Home Valuation Report for This Property
The Home Valuation Report is an in-depth analysis detailing your home's value as well as a comparison with similar homes in the area
Home Values in the Area
Average Home Value in this Area
Purchase History
We collect this data history from publicly available records. To have your information removed, we recommend requesting removal directly through your county’s website.
| Date | Buyer | Sale Price | Title Company |
|---|---|---|---|
| Jennifer L Torres Revocable Trust | -- | None Listed On Document | |
| Torres Eduardo H | -- | Hartung Title Order | |
| City Of Sandusky | -- | None Available | |
| City Of Sandusky | -- | Southern Title Of Ohio Ltd |
Source: Public Records
Mortgage History
We collect this data history from publicly available records. To have your information removed, we recommend requesting removal directly through your county’s website.
| Date | Status | Borrower | Loan Amount |
|---|---|---|---|
| Previous Owner | Torres Eduardo H | $693,500 |
Source: Public Records
Tax History
| Year | Tax Paid | Tax Assessment Tax Assessment Total Assessment is a certain percentage of the fair market value that is determined by local assessors to be the total taxable value of land and additions on the property. | Land | Improvement |
|---|---|---|---|---|
| 2025 | $1,967 | $182,923 | $6,254 | $176,669 |
| 2024 | $1,967 | $182,923 | $6,254 | $176,669 |
| 2023 | $1,986 | $153,310 | $4,903 | $148,407 |
| 2022 | $2,129 | $153,310 | $4,903 | $148,407 |
| 2021 | $0 | $5,210 | $4,570 | $640 |
| 2020 | $32 | $12,690 | $12,050 | $640 |
| 2019 | $923 | $12,690 | $12,050 | $640 |
| 2018 | $918 | $12,690 | $12,050 | $640 |
| 2017 | $880 | $11,930 | $11,250 | $680 |
| 2016 | $877 | $11,930 | $11,250 | $680 |
| 2015 | $816 | $11,930 | $11,250 | $680 |
| 2014 | $1,030 | $14,920 | $9,140 | $5,780 |
| 2013 | $1,027 | $14,920 | $9,140 | $5,780 |
Source: Public Records
Map
Nearby Homes
- 421 E Adams St
- 403 E Adams St
- 423 Hancock St
- 519 Huron Ave
- 3 Curran St
- 4 Curran St
- 616 Meigs St
- 415 W Water St
- 732 Warren St
- 401 W Shoreline Dr Unit 312
- 401 W Shoreline Dr Unit 234
- 401 W Shoreline Dr Unit 130
- 401 W Shoreline Dr Unit 223
- 401 W Shoreline Dr Unit 204
- 401 W Shoreline Dr Unit 314
- 401 W Shoreline Dr Unit 102
- 401 W Shoreline Dr Unit 116
- 401 W Shoreline Dr Unit 244
- 401 W Shoreline Dr Unit 261
- 401 W Shoreline Dr Unit 213
- 425 E Market St
- 410 Market St
- 419 E Market St
- 216 Franklin St
- 421 E Washington St
- 413 E Washington St
- 2 E Market St
- 3 E Market St
- 1 E Market St
- 0 E Market St
- 1-A E Market St
- 3-C E Market St
- 2-B E Market St
- 409 E Washington St
- 603 E Washinton
- 530 E Market St
- 521 E Washington St
- 532 E Market St
- 403 E Washington St
- 213 Perry St
Your Personal Tour Guide
Ask me questions while you tour the home.