Estimated Value: $564,674 - $688,000
About This Home
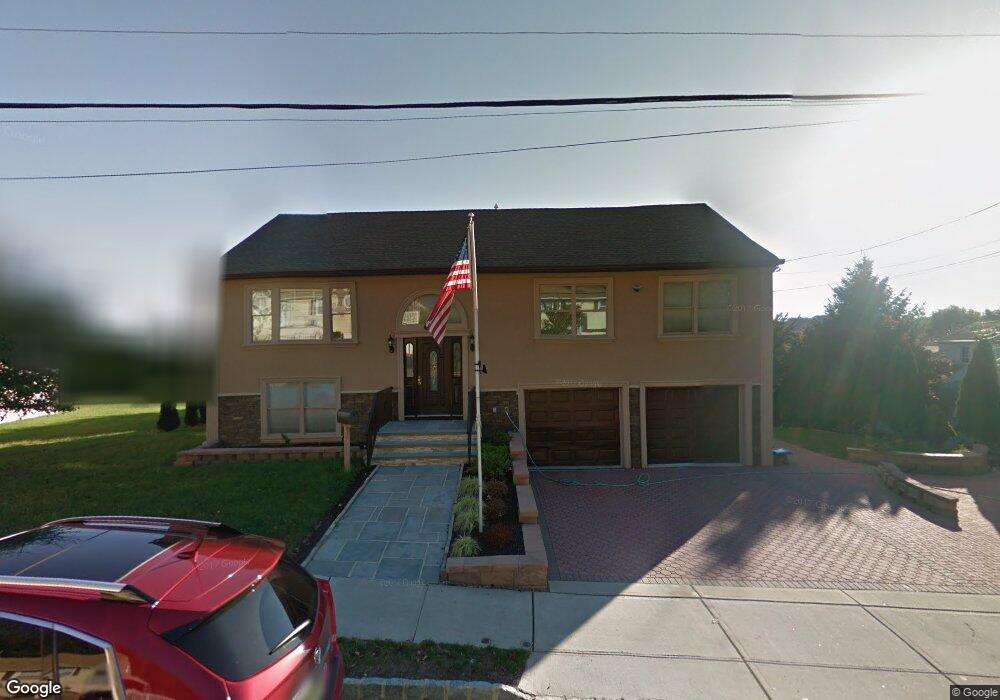
This home is located at 430 E Mcfarlan St, Dover, NJ 07801 and is currently estimated at $613,169, approximately $236 per square foot. 430 E Mcfarlan St is a home located in Morris County with nearby schools including Dover Middle School and Dover High School.
Ownership History
We collect this data history from publicly available records. To have your information removed, we recommend requesting removal directly through your county’s website.
Purchase Details
Home Financials for this Owner
Home Financials are based on the most recent Mortgage that was taken out on this home.Purchase Details
Home Values in the Area
Average Home Value in this Area
Purchase History
We collect this data history from publicly available records. To have your information removed, we recommend requesting removal directly through your county’s website.
| Date | Buyer | Sale Price | Title Company |
|---|---|---|---|
| $280,000 | -- | ||
| -- | -- |
Mortgage History
We collect this data history from publicly available records. To have your information removed, we recommend requesting removal directly through your county’s website.
| Date | Status | Borrower | Loan Amount |
|---|---|---|---|
| Open | $251,750 |
Tax History
We collect this data history from publicly available records. To have your information removed, we recommend requesting removal directly through your county’s website.
| Year | Tax Paid | Tax Assessment Tax Assessment Total Assessment is a certain percentage of the fair market value that is determined by local assessors to be the total taxable value of land and additions on the property. | Land | Improvement |
|---|---|---|---|---|
| 2025 | $12,706 | $388,200 | $87,500 | $300,700 |
| 2024 | $12,255 | $388,200 | $87,500 | $300,700 |
| 2023 | $12,255 | $388,200 | $87,500 | $300,700 |
| 2022 | $10,454 | $388,200 | $87,500 | $300,700 |
| 2021 | $10,454 | $385,800 | $87,500 | $298,300 |
| 2020 | $10,976 | $385,800 | $87,500 | $298,300 |
| 2019 | $10,521 | $385,800 | $87,500 | $298,300 |
| 2018 | $9,942 | $385,800 | $87,500 | $298,300 |
| 2017 | $9,491 | $385,800 | $87,500 | $298,300 |
| 2016 | $9,267 | $385,800 | $87,500 | $298,300 |
| 2015 | $7,832 | $381,100 | $146,000 | $235,100 |
| 2014 | $7,752 | $381,100 | $146,000 | $235,100 |
Map
- 8 N Salem St
- 27 Belmont Ave
- 450 Herrick Dr
- 372-374 E Blackwell St
- 376 E Blackwell St
- 54 Highview Terrace
- 318 Daniel St
- 119 King St Unit 121
- 105-107 Berry St
- 110-112 Berry St
- 208 Perry St
- 145 Elm St
- 138 S Salem St
- 540 Herrick Dr
- 11 Overlook Dr
- 130 Lincoln Ave
- 25 Passaic St
- 411 Boulder Ridge Dr
- 54 C E Blackwell St Unit C
- 71 Washington Ave Unit 73
- 42 Simms St
- 436 E Mcfarlan St
- 6 Beatty St
- 9 Ekstrom St
- 4 Beatty St
- 431 E Mcfarlan St
- 421 E Mcfarlan St
- 415 E Mcfarlan St
- 13 Ekstrom St
- 435 E Mcfarlan St
- 414 E Mcfarlan St
- 439 E Mcfarlan St
- 41 Simms St
- 8 Ekstrom St
- 17 Ekstrom St
- 2 Beatty St
- 443 E Mcfarlan St
- 408 E Mcfarlan St
- 14 Ekstrom St
- 413 E Mcfarlan St
Ask me questions while you tour the home.