Estimated Value: $151,000 - $180,000
3
Beds
1
Bath
1,449
Sq Ft
$111/Sq Ft
Est. Value
About This Home
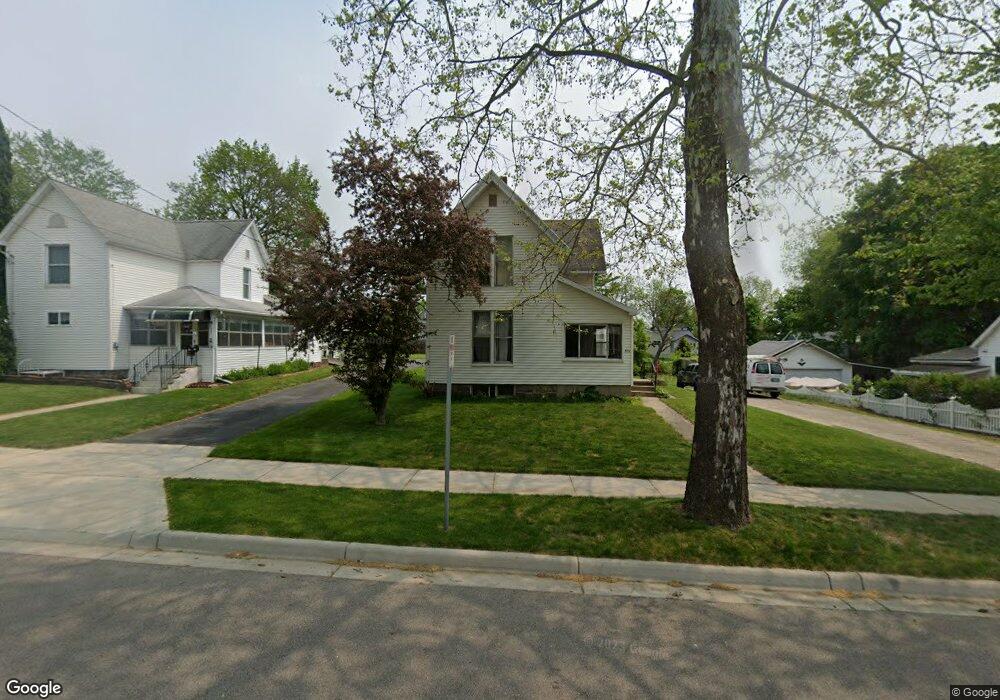
This home is located at 430 N State St, Ionia, MI 48846 and is currently estimated at $160,373, approximately $110 per square foot. 430 N State St is a home located in Ionia County with nearby schools including Ionia High School, Saints Peter and Paul Catholic School, and Ionia Seventh Day Adventist Elementary School.
Ownership History
Date
Name
Owned For
Owner Type
Purchase Details
Closed on
Oct 15, 2025
Sold by
Lopez S S and Lopez F D
Bought by
Schild Matthew J
Current Estimated Value
Home Financials for this Owner
Home Financials are based on the most recent Mortgage that was taken out on this home.
Original Mortgage
$166,920
Outstanding Balance
$165,231
Interest Rate
0.62%
Mortgage Type
Construction
Estimated Equity
-$4,858
Purchase Details
Closed on
Dec 21, 2005
Sold by
Kemp Gregory A
Bought by
Kemp Shirley
Home Financials for this Owner
Home Financials are based on the most recent Mortgage that was taken out on this home.
Original Mortgage
$70,200
Interest Rate
9.59%
Mortgage Type
New Conventional
Purchase Details
Closed on
May 27, 1993
Bought by
Kemp Shirley
Create a Home Valuation Report for This Property
The Home Valuation Report is an in-depth analysis detailing your home's value as well as a comparison with similar homes in the area
Home Values in the Area
Average Home Value in this Area
Purchase History
| Date | Buyer | Sale Price | Title Company |
|---|---|---|---|
| Schild Matthew J | $170,000 | Next Door Title Agcy Llc | |
| Kemp Shirley | -- | Titlequest Agency | |
| Kemp Shirley | $46,000 | -- |
Source: Public Records
Mortgage History
| Date | Status | Borrower | Loan Amount |
|---|---|---|---|
| Open | Schild Matthew J | $166,920 | |
| Previous Owner | Kemp Shirley | $70,200 |
Source: Public Records
Tax History
| Year | Tax Paid | Tax Assessment Tax Assessment Total Assessment is a certain percentage of the fair market value that is determined by local assessors to be the total taxable value of land and additions on the property. | Land | Improvement |
|---|---|---|---|---|
| 2025 | $2,466 | $63,300 | $13,100 | $50,200 |
| 2024 | $23 | $63,300 | $13,100 | $50,200 |
| 2023 | $2,239 | $49,300 | $9,700 | $39,600 |
| 2022 | $2,132 | $44,300 | $8,600 | $35,700 |
| 2021 | $2,176 | $38,200 | $8,600 | $29,600 |
| 2020 | $2,056 | $38,200 | $8,600 | $29,600 |
| 2019 | $2,356 | $38,100 | $7,100 | $31,000 |
| 2018 | $2,094 | $35,400 | $6,300 | $29,100 |
| 2017 | $1,817 | $35,400 | $6,300 | $29,100 |
| 2016 | $2,356 | $31,300 | $5,000 | $26,300 |
| 2015 | -- | $31,300 | $5,000 | $26,300 |
| 2014 | $1,166 | $29,700 | $6,200 | $23,500 |
Source: Public Records
Map
Nearby Homes
- 720 W Lincoln Ave
- 518 N State St
- 240 Yeomans St
- 407 Forest St
- 548 Hall St
- 428 W Lincoln Ave
- 302 W Lincoln Ave
- 1133 Yeomans St Unit 92
- 1133 Yeomans St Unit 175
- 1133 Yeomans St Unit 252
- 1133 Yeomans St Unit 256
- 1133 Yeomans St Unit 47
- 1133 Yeomans St Unit 104
- 1133 Yeomans St Unit 19
- 261 S Dexter St
- 119 Lafayette St
- 00 Brown Blvd
- V/L Webber St
- 258 E Adams St
- 517 N Jefferson St
Your Personal Tour Guide
Ask me questions while you tour the home.