
Seller's Agent in 2018
Chad Gradowski
Coldwell Banker Realty
(219) 241-9083
287 Total Sales

Estimated Value: $838,000 - $1,078,000
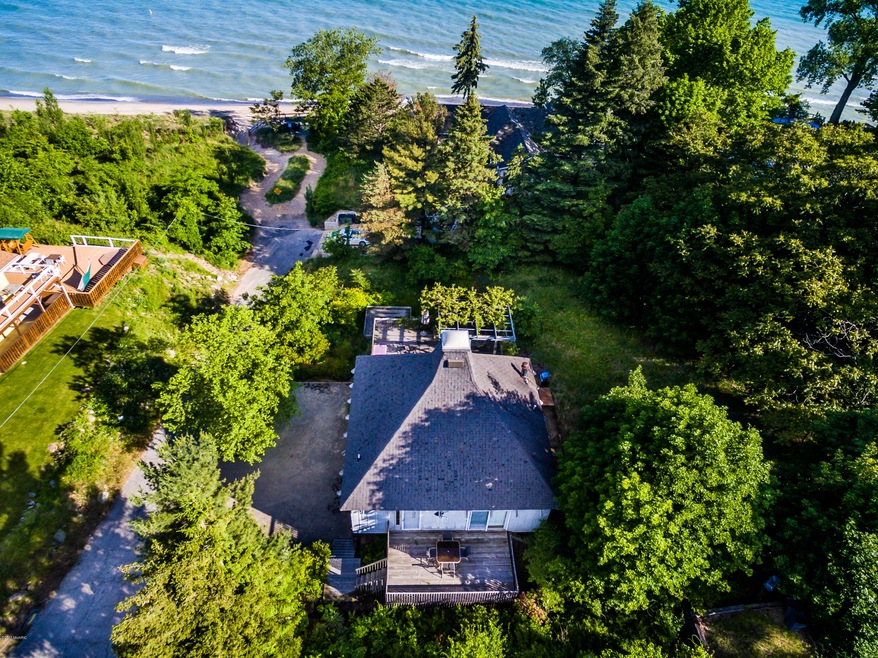
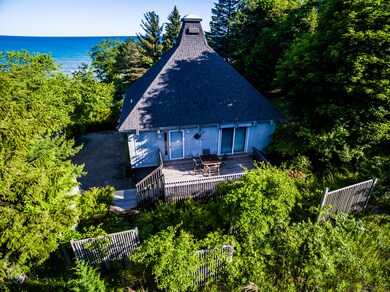
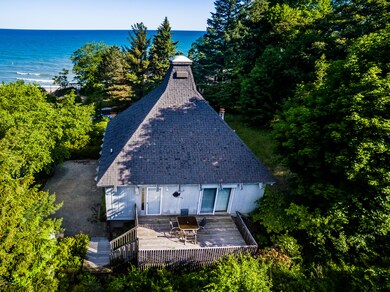
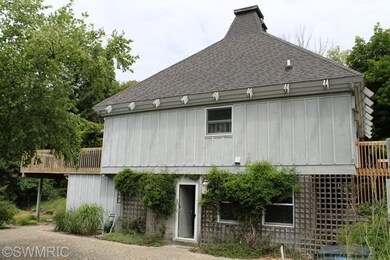
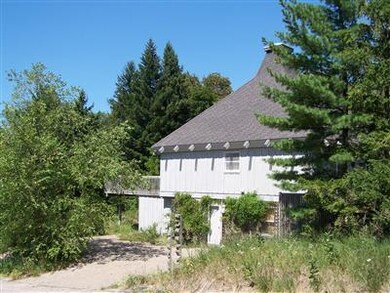
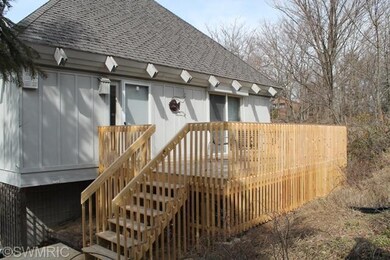
LOCATION, LOCATION, LOCATION! This is a gorgeous Michiana Shores location with gorgeous Lake Michigan views and a gentle slope to the beautiful beach just a few steps away. With 4BR/4BA, this house is well suited to great getaways with room for everyone. Large deck facing the lake perfect for parties and sunsets. Locations like this don't come on the market every day - now is your chance to make it yours. There is even room for a pool. Rehab or enjoy in as-is and start making your Harbor Country memories. Just about an hour from downtown Chicago, but feels a million miles from everything. This is the private, peaceful Harbor Country getaway you've been looking for!
Last Agent to Sell the Property
Coldwell Banker Realty License #6502355194 Listed on: 02/20/2018
Last Buyer's Agent
Kathrin Cordell
@properties Christie's International R.E. License #6501403433
| Date | Buyer | Sale Price | Title Company |
|---|---|---|---|
| Burland Kori | -- | None Available | |
| -- | $560,000 | -- | |
| -- | $100 | -- | |
| -- | $15,400 | -- |
| Date | Event | Price | List to Sale | Price per Sq Ft |
|---|---|---|---|---|
| 04/09/2018 04/09/18 | Sold | $714,000 | -9.5% | $280 / Sq Ft |
| 02/23/2018 02/23/18 | Pending | -- | -- | -- |
| 02/20/2018 02/20/18 | For Sale | $789,000 | -- | $309 / Sq Ft |
| Year | Tax Paid | Tax Assessment Tax Assessment Total Assessment is a certain percentage of the fair market value that is determined by local assessors to be the total taxable value of land and additions on the property. | Land | Improvement |
|---|---|---|---|---|
| 2025 | $5,809 | $249,300 | $0 | $0 |
| 2024 | $4,780 | $239,700 | $0 | $0 |
| 2023 | $4,698 | $244,000 | $0 | $0 |
| 2022 | $4,492 | $148,400 | $0 | $0 |
| 2021 | $6,146 | $141,800 | $47,300 | $94,500 |
| 2020 | $6,058 | $127,800 | $0 | $0 |
| 2019 | $12,221 | $256,200 | $164,000 | $92,200 |
| 2018 | $9,675 | $253,700 | $0 | $0 |
| 2017 | $6,022 | $243,600 | $0 | $0 |
| 2016 | $5,612 | $129,200 | $0 | $0 |
| 2015 | $5,589 | $130,200 | $0 | $0 |
| 2014 | $2,982 | $118,600 | $0 | $0 |
Seller's Agent in 2018
Chad Gradowski
Coldwell Banker Realty
(219) 241-9083
287 Total Sales
K
Buyer's Agent in 2018
Kathrin Cordell
@ Properties
Source: MichRIC
MLS Number: 18005990
APN: 11-41-5050-0146-00-3
Disclaimer: Certain information contained herein is derived from information provided by parties other than Homes.com. All information provided is deemed reliable, but is not guaranteed to be accurate and should be independently verified.
![]() Information is deemed reliable but not guaranteed.
Information is deemed reliable but not guaranteed.
Copyright 2026 MichRIC, LLC. All rights reserved.
Ask me questions while you tour the home.