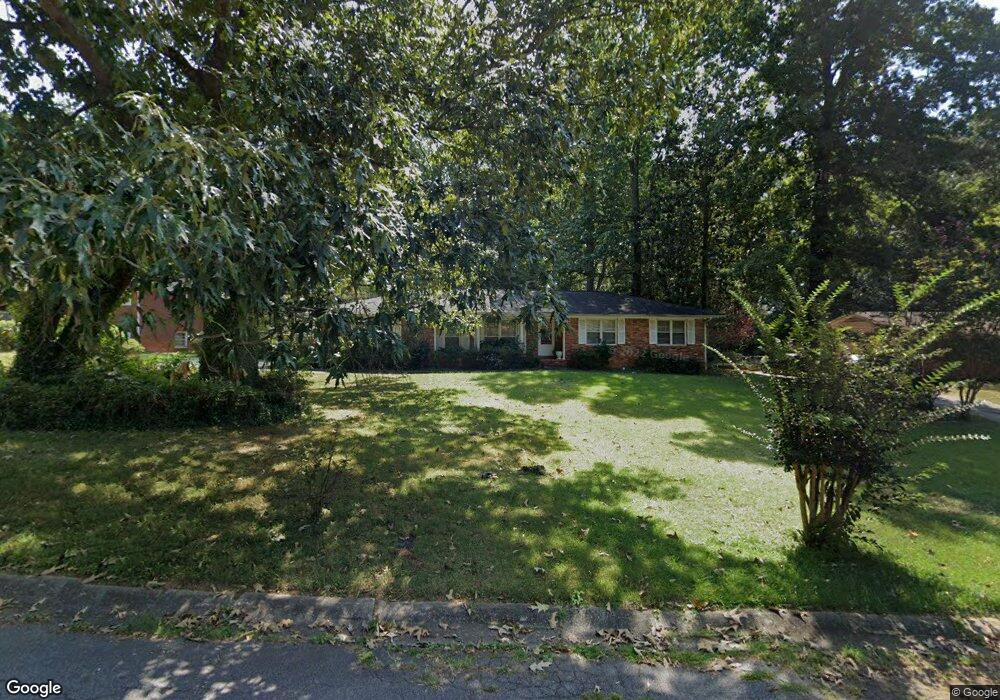
4301 Allgood Way Unit 2 Stone Mountain, GA 30083
Estimated Value: $219,000 - $266,000
4
Beds
2
Baths
1,651
Sq Ft
$145/Sq Ft
Est. Value
About This Home
This home is located at 4301 Allgood Way Unit 2, Stone Mountain, GA 30083 and is currently estimated at $239,840, approximately $145 per square foot. 4301 Allgood Way Unit 2 is a home located in DeKalb County with nearby schools including Allgood Elementary School, Freedom Middle School, and Clarkston High School.
Ownership History
Date
Name
Owned For
Owner Type
Purchase Details
Closed on
Sep 20, 2017
Sold by
3 Ih2 Borrower Trust
Bought by
Dyer Sherwin
Current Estimated Value
Purchase Details
Closed on
Oct 5, 2016
Sold by
2015 3 Ih2 Borrower Lp
Bought by
2015 3 Ih2 Borrower Trust Llc
Purchase Details
Closed on
Jun 25, 2015
Sold by
Ih2 Property Georgia Lp
Bought by
2015 3 Ih2 Borrower Lp
Purchase Details
Closed on
Jun 26, 2013
Sold by
Pointone Holdings Iii Lp
Bought by
Ih2 Property Georgia Lp
Purchase Details
Closed on
Feb 7, 2012
Sold by
Brock Jeff
Bought by
Pointone Holdings Iii Lp
Purchase Details
Closed on
Jul 10, 1997
Sold by
Mccart Ruth Ann
Bought by
Amos Mildred L
Home Financials for this Owner
Home Financials are based on the most recent Mortgage that was taken out on this home.
Original Mortgage
$84,850
Interest Rate
7.61%
Mortgage Type
FHA
Create a Home Valuation Report for This Property
The Home Valuation Report is an in-depth analysis detailing your home's value as well as a comparison with similar homes in the area
Home Values in the Area
Average Home Value in this Area
Purchase History
| Date | Buyer | Sale Price | Title Company |
|---|---|---|---|
| Dyer Sherwin | $109,500 | -- | |
| 2015 3 Ih2 Borrower Trust Llc | -- | -- | |
| 2015 3 Ih2 Borrower Lp | -- | -- | |
| Ih2 Property Georgia Lp | $2,542,221 | -- | |
| Pointone Holdings Iii Lp | -- | -- | |
| Brock Jeff | $24,000 | -- | |
| Amos Mildred L | $91,500 | -- |
Source: Public Records
Mortgage History
| Date | Status | Borrower | Loan Amount |
|---|---|---|---|
| Previous Owner | Amos Mildred L | $84,850 |
Source: Public Records
Tax History
| Year | Tax Paid | Tax Assessment Tax Assessment Total Assessment is a certain percentage of the fair market value that is determined by local assessors to be the total taxable value of land and additions on the property. | Land | Improvement |
|---|---|---|---|---|
| 2025 | $4,657 | $95,800 | $16,000 | $79,800 |
| 2024 | $4,443 | $90,960 | $5,560 | $85,400 |
| 2023 | $4,443 | $90,120 | $5,560 | $84,560 |
| 2022 | $3,586 | $73,520 | $5,560 | $67,960 |
| 2021 | $2,652 | $52,240 | $5,560 | $46,680 |
| 2020 | $2,511 | $49,040 | $5,560 | $43,480 |
| 2019 | $1,965 | $36,600 | $5,490 | $31,110 |
| 2018 | $1,633 | $36,600 | $5,490 | $31,110 |
| 2017 | $1,973 | $36,600 | $5,560 | $31,040 |
| 2016 | $1,287 | $27,000 | $5,560 | $21,440 |
| 2014 | -- | $36,160 | $5,560 | $30,600 |
Source: Public Records
Map
Nearby Homes
- 737 Allgood Valley Ct
- 550 S Rays Rd
- 592 Allgood Rd
- 502 North Summit
- 557 Rue Montaigne
- 539 Rue Montaigne
- 488 Barclay Ct
- 804 Rowland Rd
- 4223 Sheppard Xing Way Unit 1
- 957 Rowland Rd
- 4153 Indian Manor Dr
- 4228 Kings Troop Rd
- 4150 Indian Lake Cir
- 407 Sheppard Xing Ct
- 755 Valley Creek Dr
- 1051 Rowland Rd
- 4050 Indian Lake Cir
- 863 Brafferton Place
- 4563 Ruby Rd
- 524 Rowland Rd
- 4291 Allgood Way Unit 2
- 4313 Allgood Way
- 723 Allgood Rd
- 4281 Allgood Way
- 729 Allgood Rd
- 715 Allgood Rd Unit 1
- 4302 Allgood Way
- 4294 Allgood Way
- 4298 Nelby Dr Unit /13
- 4310 Allgood Way Unit 2
- 4310 Allgood Way
- 4331 Allgood Way
- 4286 Allgood Way Unit 2
- 4290 Nelby Dr Unit 2
- 4318 Allgood Way Unit 2
- 4267 Allgood Way Unit 2
- 737 Allgood Rd
- 4278 Allgood Way Unit 2
- 4295 Saint Michel Ct Unit II
- 4251 Allgood Way
Your Personal Tour Guide
Ask me questions while you tour the home.