Estimated Value: $252,000 - $281,961
3
Beds
3
Baths
2,284
Sq Ft
$115/Sq Ft
Est. Value
About This Home
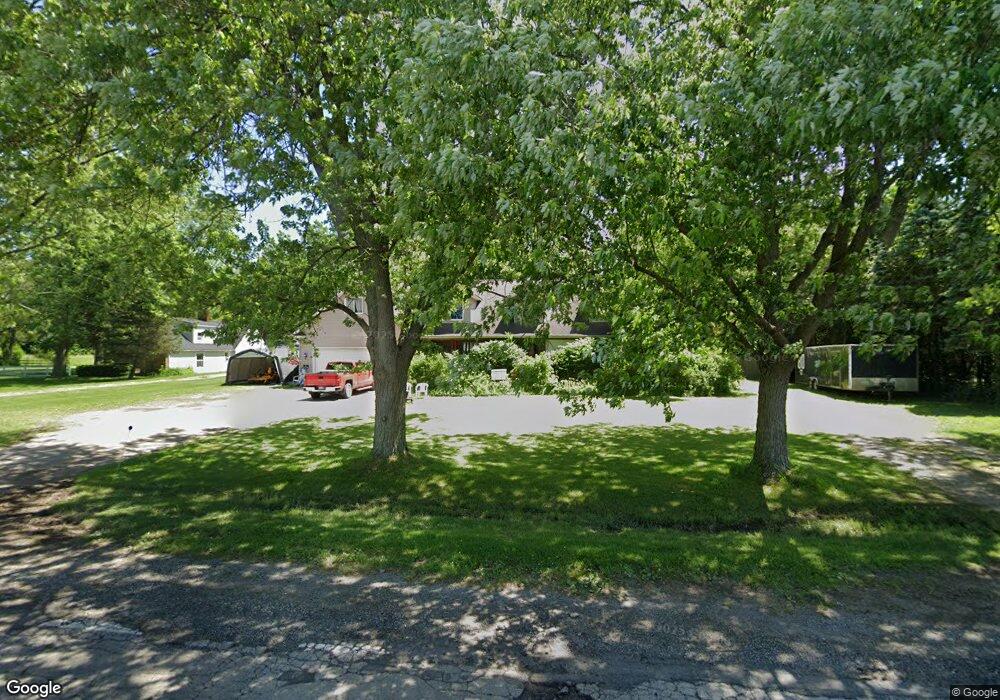
This home is located at 4302 N Vassar Rd, Flint, MI 48506 and is currently estimated at $263,740, approximately $115 per square foot. 4302 N Vassar Rd is a home located in Genesee County with nearby schools including Weston Elementary School, Leota Fiedler Elementary School, and Kate Dowdall Elementary School.
Ownership History
Date
Name
Owned For
Owner Type
Purchase Details
Closed on
Oct 18, 2011
Sold by
Adkins Lynne M
Bought by
Adkins Lynne and Persails Gerald
Current Estimated Value
Purchase Details
Closed on
Jun 24, 2009
Sold by
Roster Vincke John Joseph and Roster Clark Vincke Linda
Bought by
Federal Home Loan Mortgage Corp
Purchase Details
Closed on
Mar 29, 2006
Sold by
Clark Linda R and Vincke Linda R
Bought by
Vincke John J
Purchase Details
Closed on
Mar 27, 2000
Sold by
Clark Linda Roster
Bought by
Roster Vincke John Joseph and Roster Clark Vincke Linda
Create a Home Valuation Report for This Property
The Home Valuation Report is an in-depth analysis detailing your home's value as well as a comparison with similar homes in the area
Home Values in the Area
Average Home Value in this Area
Purchase History
We collect this data history from publicly available records. To have your information removed, we recommend requesting removal directly through your county’s website.
| Date | Buyer | Sale Price | Title Company |
|---|---|---|---|
| Adkins Lynne | -- | None Available | |
| Federal Home Loan Mortgage Corp | $108,000 | None Available | |
| Vincke John J | -- | None Available | |
| Roster Vincke John Joseph | -- | Sargents Abstract & Title Co |
Source: Public Records
Tax History
| Year | Tax Paid | Tax Assessment Tax Assessment Total Assessment is a certain percentage of the fair market value that is determined by local assessors to be the total taxable value of land and additions on the property. | Land | Improvement |
|---|---|---|---|---|
| 2025 | $2,791 | $141,600 | $0 | $0 |
| 2024 | $806 | $131,400 | $0 | $0 |
| 2023 | $769 | $116,100 | $0 | $0 |
| 2022 | $2,655 | $102,300 | $0 | $0 |
| 2021 | $2,634 | $96,100 | $0 | $0 |
| 2020 | $703 | $91,700 | $0 | $0 |
| 2019 | $692 | $84,800 | $0 | $0 |
| 2018 | $1,384 | $73,000 | $0 | $0 |
| 2017 | $2,254 | $73,000 | $0 | $0 |
| 2016 | $2,435 | $68,300 | $0 | $0 |
| 2015 | $1,608 | $58,800 | $0 | $0 |
| 2014 | $638 | $57,200 | $0 | $0 |
Source: Public Records
Map
Nearby Homes
- 4450 N Vassar Rd
- 6437 Oriole Dr
- 4156 Bobwhite Dr
- 6350 Tamara Dr
- 6443 Richfield Rd
- 5165 N Irish Rd
- 5189 N Irish Rd
- 5177 N Irish Rd
- 1240 N Irish Rd
- 6062 Hopkins Rd
- 6054 E Pierson Rd
- 5481 Tipperary Ln
- 5482 Shamrock Ln
- 0 Whisper Ridge Ct
- 7200 E Potter Rd
- 2465 Mcclellan Blvd
- 4347 N Gale Rd
- 6058 Thomas St
- 2423 Whisper Ridge Dr
- 2411 Briar Creek Ln
- 4302 N Vassar Rd
- 4308 N Vassar Rd
- 4272 N Vassar Rd
- 4324 N Vassar Rd
- 4338 N Vassar Rd
- 4284 N Vassar Rd
- 4254 N Vassar Rd
- 4370 N Vassar Rd
- 4210 N Vassar Rd
- 4307 N Vassar Rd
- 4265 N Vassar Rd
- 4255 N Vassar Rd
- 4343 N Vassar Rd
- 7050 Normandy Ct
- 7040 Normandy Ct
- 4353 N Vassar Rd
- 6504 Bluejay Dr
- 4348 N Vassar Rd
- 7030 Normandy Ct
- 4356 N Vassar Rd
Your Personal Tour Guide
Ask me questions while you tour the home.