431 18th Ave Indian Rocks Beach, FL 33785
Estimated Value: $783,000 - $1,415,000
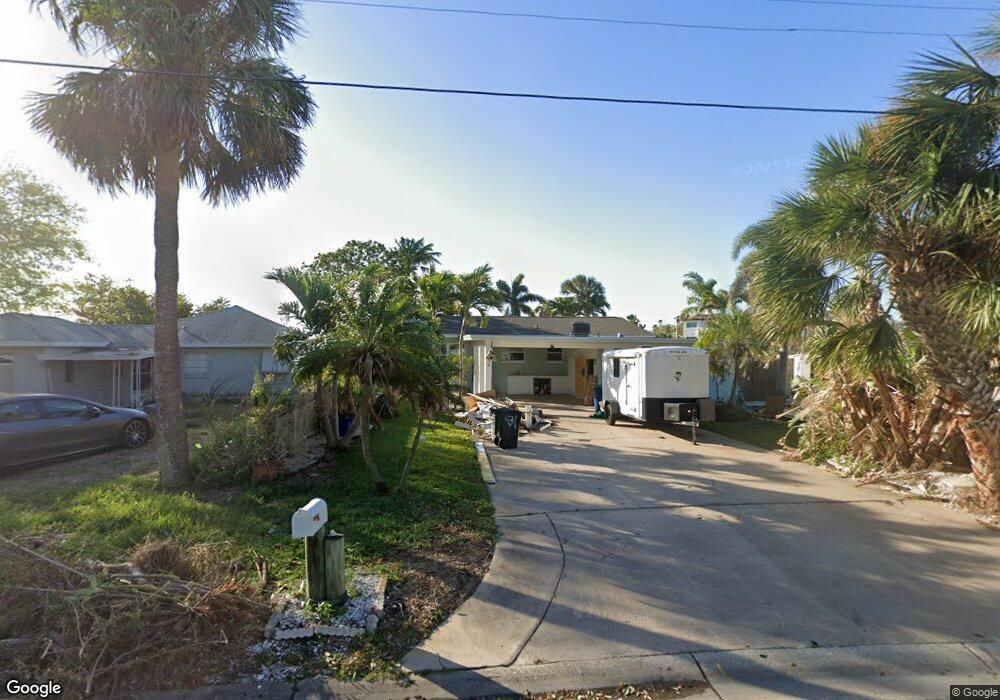
About This Home
This home is located at 431 18th Ave, Indian Rocks Beach, FL 33785 and is currently estimated at $1,117,591, approximately $711 per square foot. 431 18th Ave is a home with nearby schools including Anona Elementary School, Largo High School, and Seminole Middle School.
Ownership History
We collect this data history from publicly available records. To have your information removed, we recommend requesting removal directly through your county’s website.
Purchase Details
Home Financials for this Owner
Home Financials are based on the most recent Mortgage that was taken out on this home.Purchase Details
Home Values in the Area
Average Home Value in this Area
Purchase History
We collect this data history from publicly available records. To have your information removed, we recommend requesting removal directly through your county’s website.
| Date | Buyer | Sale Price | Title Company |
|---|---|---|---|
| $88,900 | -- | ||
| $167,400 | -- |
Mortgage History
We collect this data history from publicly available records. To have your information removed, we recommend requesting removal directly through your county’s website.
| Date | Status | Borrower | Loan Amount |
|---|---|---|---|
| Open | $75,000 | ||
| Open | $207,000 | ||
| Closed | $205,000 |
Tax History
We collect this data history from publicly available records. To have your information removed, we recommend requesting removal directly through your county’s website.
| Year | Tax Paid | Tax Assessment Tax Assessment Total Assessment is a certain percentage of the fair market value that is determined by local assessors to be the total taxable value of land and additions on the property. | Land | Improvement |
|---|---|---|---|---|
| 2025 | $4,846 | $326,988 | -- | -- |
| 2024 | $4,789 | $330,722 | -- | -- |
| 2023 | $4,789 | $321,089 | $0 | $0 |
| 2022 | $4,524 | $311,737 | $0 | $0 |
| 2021 | $4,611 | $302,657 | $0 | $0 |
| 2020 | $4,612 | $298,478 | $0 | $0 |
| 2019 | $4,546 | $291,767 | $0 | $0 |
| 2018 | $4,397 | $286,327 | $0 | $0 |
| 2017 | $4,396 | $280,438 | $0 | $0 |
| 2016 | $4,374 | $274,670 | $0 | $0 |
| 2015 | $4,468 | $272,761 | $0 | $0 |
| 2014 | $4,450 | $270,596 | $0 | $0 |
Map
- 1507 Legion Ln
- 1217 Bayshore Blvd
- 1213 Bayshore Blvd
- 1811 2nd St
- 407 20th Ave
- 412 20th Ave
- 391 12th Ave
- 109 16th Ave Unit 3
- 1213 Bay Palm Blvd
- 108 17th Ave
- 418 12th Ave
- 370 12th Ave
- 317 12th Ave
- 321 12th Ave
- 372 12th Ave
- 333 12th Ave
- 1207 1st St
- 1800 Gulf Blvd Unit 1
- 121 13th Ave
- 1500 Gulf Blvd Unit 204B
Ask me questions while you tour the home.