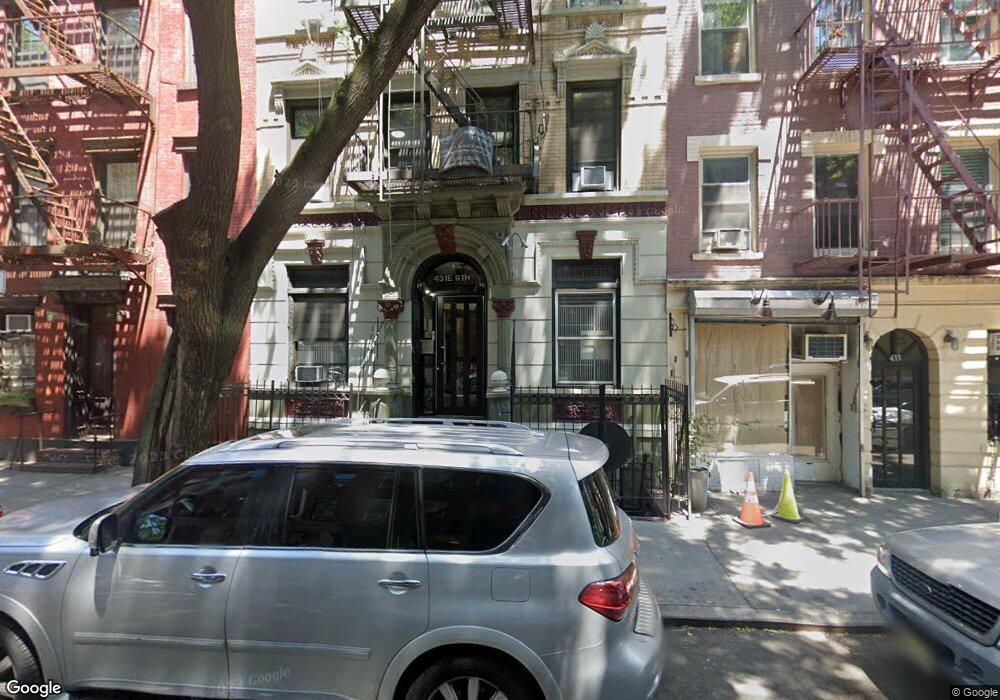
431 E 9th St Unit 19 New York, NY 10009
East Village Neighborhood
2
Beds
--
Bath
--
Sq Ft
--
Built
About This Home
Furnished unit
Ownership History
We collect this data history from publicly available records. To have your information removed, we recommend requesting removal directly through your county’s website.
Date
Name
Owned For
Owner Type
Purchase Details
Closed on
May 7, 1999
Sold by
Bought by
Home Financials for this Owner
Home Financials are based on the most recent Mortgage that was taken out on this home.
Original Mortgage
$140,000
Interest Rate
0.0699%
Mortgage Type
Commercial
Create a Home Valuation Report for This Property
The Home Valuation Report is an in-depth analysis detailing your home's value as well as a comparison with similar homes in the area
Home Values in the Area
Average Home Value in this Area
Property History
We collect this data history from publicly available records. To have your information removed, we recommend requesting removal directly through your county’s website.
| Date | Event | Price | List to Sale | Price per Sq Ft |
|---|---|---|---|---|
| 11/06/2024 11/06/24 | Off Market | $3,150 | -- | -- |
| 10/30/2024 10/30/24 | For Rent | $3,150 | 0.0% | -- |
| 10/30/2024 10/30/24 | Price Changed | $3,150 | -1.6% | -- |
| 10/07/2024 10/07/24 | For Rent | $3,200 | -- | -- |
Tax History
We collect this data history from publicly available records. To have your information removed, we recommend requesting removal directly through your county’s website.
| Year | Tax Paid | Tax Assessment Tax Assessment Total Assessment is a certain percentage of the fair market value that is determined by local assessors to be the total taxable value of land and additions on the property. | Land | Improvement |
|---|---|---|---|---|
| 2026 | $143,878 | $1,233,900 | $270,900 | $963,000 |
| 2025 | $142,868 | $1,151,020 | $270,900 | $880,120 |
| 2024 | $142,868 | $1,142,760 | $270,900 | $871,860 |
| 2023 | $138,225 | $1,126,800 | $270,900 | $855,900 |
| 2022 | $143,205 | $1,170,450 | $270,900 | $899,550 |
| 2021 | $134,912 | $1,099,800 | $270,900 | $828,900 |
| 2020 | $164,506 | $1,417,500 | $270,900 | $1,146,600 |
| 2019 | $162,555 | $1,407,150 | $270,900 | $1,136,250 |
| 2018 | $154,398 | $1,305,450 | $270,900 | $1,034,550 |
| 2017 | $144,726 | $1,307,250 | $270,900 | $1,036,350 |
| 2016 | $136,078 | $1,228,950 | $270,900 | $958,050 |
| 2015 | $60,048 | $1,195,650 | $270,900 | $924,750 |
| 2014 | $60,048 | $1,032,300 | $270,900 | $761,400 |
Source: Public Records
Map
Nearby Homes
- 416 E 11th St Unit 6C
- 121 E 7th St
- 307 E 10th St
- 438 E 12th St Unit 5Q
- 438 E 12th St Unit PHH
- 438 E 12th St Unit 2Q
- 438 E 12th St Unit 6C
- 239 E 10th St Unit GARDEN A
- 518 E 11th St Unit 4A
- 240 E 10th St Unit 10B
- 240 E 10th St Unit 5B
- 519 E 11th St Unit 5E
- 427 E 12th St Unit 2B
- 427 E 12th St Unit 3A
- 525 E 11th St Unit 6C
- 525 E 11th St Unit 3C
- 407 E 12th St Unit PHF-SW
- 407 E 12th St Unit 1RSE
- 206 1st Ave Unit 1B / 2nd Floor
- 311 E 11th St Unit 3D
- 431 E 9th St Unit 5
- 431 E 9th St Unit 11
- 431 E 9th St Unit GFW
- 431 E 9th St Unit 6
- 431 E 9th St
- 431 E 9th St Unit 1
- 431 E 9th St Unit 9
- 431 E 9th St Unit 16
- 431 E 9th St Unit 15
- 431 E 9th St
- 433 E 9th St
- 433 E 9th St Unit 6
- 427 E 9th St
- 427 E 9th St Unit 1
- 429 E 9th St Unit 3
- 429 E 9th St
- 429 E 9th St Unit 4
- 429 E 9th St Unit 1
- 429 E 9th St Unit 7
- 429 E 9th St Unit 8
Your Personal Tour Guide
Ask me questions while you tour the home.