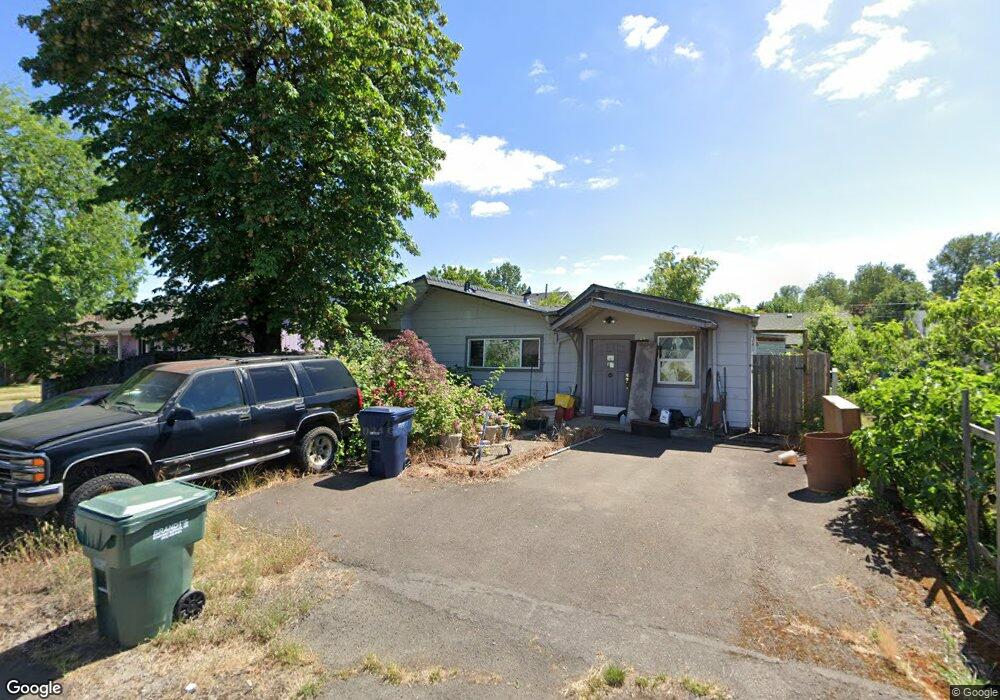
431 Marsh St Independence, OR 97351
Estimated Value: $339,645 - $405,000
3
Beds
2
Baths
1,328
Sq Ft
$275/Sq Ft
Est. Value
About This Home
This home is located at 431 Marsh St, Independence, OR 97351 and is currently estimated at $365,661, approximately $275 per square foot. 431 Marsh St is a home located in Polk County with nearby schools including Independence Elementary School, Talmadge Middle School, and Central High School.
Ownership History
Date
Name
Owned For
Owner Type
Purchase Details
Closed on
Oct 16, 2023
Sold by
Crocker Tykeson H
Bought by
Crocker Tykeson H
Current Estimated Value
Home Financials for this Owner
Home Financials are based on the most recent Mortgage that was taken out on this home.
Original Mortgage
$261,600
Outstanding Balance
$247,154
Interest Rate
7.12%
Mortgage Type
New Conventional
Estimated Equity
$118,507
Purchase Details
Closed on
Jul 7, 2008
Sold by
Scott Chester
Bought by
Crocker Tykeson H
Home Financials for this Owner
Home Financials are based on the most recent Mortgage that was taken out on this home.
Original Mortgage
$155,213
Interest Rate
6.04%
Mortgage Type
FHA
Create a Home Valuation Report for This Property
The Home Valuation Report is an in-depth analysis detailing your home's value as well as a comparison with similar homes in the area
Home Values in the Area
Average Home Value in this Area
Purchase History
| Date | Buyer | Sale Price | Title Company |
|---|---|---|---|
| Crocker Tykeson H | -- | Mortgage Connect | |
| Crocker Tykeson H | $157,650 | Ticor Title |
Source: Public Records
Mortgage History
| Date | Status | Borrower | Loan Amount |
|---|---|---|---|
| Open | Crocker Tykeson H | $261,600 | |
| Previous Owner | Crocker Tykeson H | $155,213 |
Source: Public Records
Tax History
| Year | Tax Paid | Tax Assessment Tax Assessment Total Assessment is a certain percentage of the fair market value that is determined by local assessors to be the total taxable value of land and additions on the property. | Land | Improvement |
|---|---|---|---|---|
| 2025 | $1,783 | $101,400 | $29,480 | $71,920 |
| 2024 | $1,783 | $98,450 | $28,620 | $69,830 |
| 2023 | $1,829 | $95,590 | $27,780 | $67,810 |
| 2022 | $1,679 | $92,810 | $26,970 | $65,840 |
| 2021 | $1,661 | $90,110 | $26,180 | $63,930 |
| 2020 | $1,617 | $87,490 | $25,420 | $62,070 |
| 2019 | $1,575 | $84,950 | $24,680 | $60,270 |
| 2018 | $1,525 | $82,480 | $23,960 | $58,520 |
| 2017 | $1,517 | $80,080 | $23,260 | $56,820 |
| 2016 | $1,545 | $77,750 | $22,590 | $55,160 |
Source: Public Records
Map
Nearby Homes
Your Personal Tour Guide
Ask me questions while you tour the home.