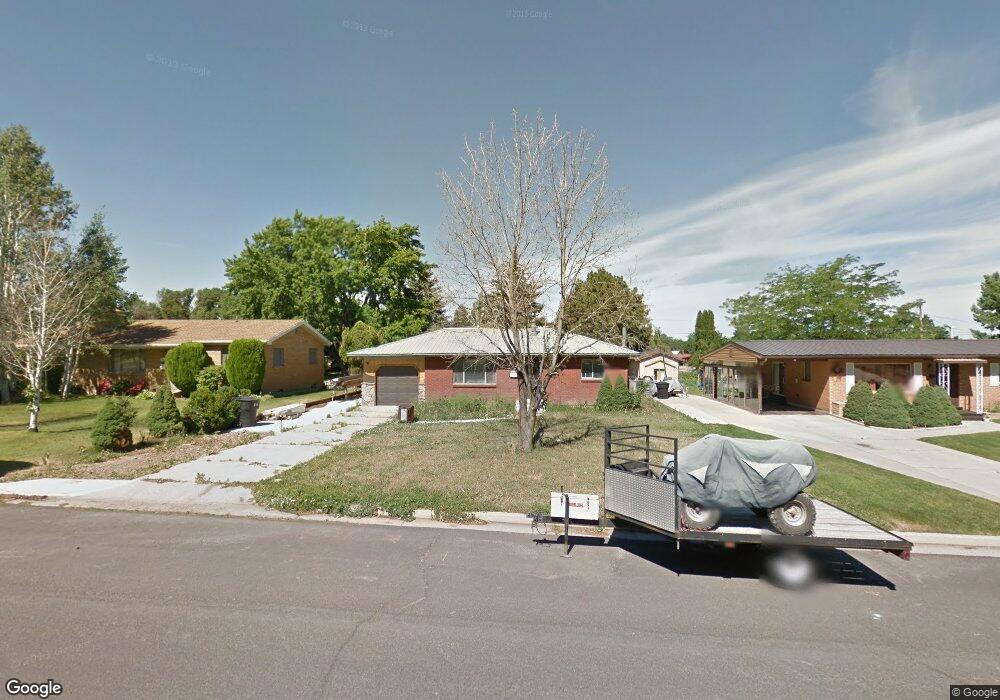
431 N 300 E Brigham City, UT 84302
Estimated Value: $387,000 - $427,000
5
Beds
3
Baths
2,198
Sq Ft
$186/Sq Ft
Est. Value
About This Home
This home is located at 431 N 300 E, Brigham City, UT 84302 and is currently estimated at $408,013, approximately $185 per square foot. 431 N 300 E is a home located in Box Elder County with nearby schools including Golden Spike Elementary, Box Elder Middle School, and Adele C. Young Intermediate School.
Ownership History
Date
Name
Owned For
Owner Type
Purchase Details
Closed on
Dec 8, 2015
Sold by
Dinsdale Tim and Dinsdale Julie
Bought by
Jorgensen Heather and Jorgensen Ben
Current Estimated Value
Home Financials for this Owner
Home Financials are based on the most recent Mortgage that was taken out on this home.
Original Mortgage
$160,877
Outstanding Balance
$126,629
Interest Rate
3.73%
Mortgage Type
FHA
Estimated Equity
$281,384
Purchase Details
Closed on
Aug 9, 2005
Sold by
Cutler Lonni J and Cutler Reva
Bought by
Dinsdale Tim and Dinsdale Jule
Create a Home Valuation Report for This Property
The Home Valuation Report is an in-depth analysis detailing your home's value as well as a comparison with similar homes in the area
Purchase History
| Date | Buyer | Sale Price | Title Company |
|---|---|---|---|
| Jorgensen Heather | -- | Mountain Title Ogden | |
| Dinsdale Tim | -- | Continental Title Ins Agency |
Source: Public Records
Mortgage History
| Date | Status | Borrower | Loan Amount |
|---|---|---|---|
| Open | Jorgensen Heather | $160,877 |
Source: Public Records
Tax History
| Year | Tax Paid | Tax Assessment Tax Assessment Total Assessment is a certain percentage of the fair market value that is determined by local assessors to be the total taxable value of land and additions on the property. | Land | Improvement |
|---|---|---|---|---|
| 2025 | $2,063 | $354,791 | $105,000 | $249,791 |
| 2024 | $1,804 | $347,274 | $100,000 | $247,274 |
| 2023 | $1,862 | $367,047 | $95,000 | $272,047 |
| 2022 | $1,867 | $188,180 | $22,000 | $166,180 |
| 2021 | $1,426 | $219,321 | $40,000 | $179,321 |
| 2020 | $1,350 | $219,321 | $40,000 | $179,321 |
| 2019 | $1,264 | $109,280 | $22,000 | $87,280 |
| 2018 | $1,139 | $97,896 | $22,000 | $75,896 |
| 2017 | $992 | $147,558 | $16,500 | $117,558 |
| 2016 | $1,038 | $78,078 | $16,500 | $61,578 |
| 2015 | $963 | $72,480 | $16,500 | $55,980 |
| 2014 | $963 | $69,814 | $16,500 | $53,314 |
| 2013 | -- | $69,814 | $16,500 | $53,314 |
Source: Public Records
Map
Nearby Homes
- 437 N 200 E
- 410 N Main St Unit 41
- 410 N Main St Unit 15
- 107 E 600 N
- 258 N 500 E
- 690 Sunset Dr
- 771 N 300 E
- 734 Fairview Dr
- 507 N 200 W
- 225 N Main St
- 355 N 200 W
- 607 Holiday Dr
- 904 Sunset Dr
- 152 N 100 W
- 508 N 400 W
- 415 W 300 N
- 425 N Highland Blvd
- 1054 N 200 W Unit W340
- 1042 N 200 W Unit 337
- 984 N 200 W Unit V335
Your Personal Tour Guide
Ask me questions while you tour the home.