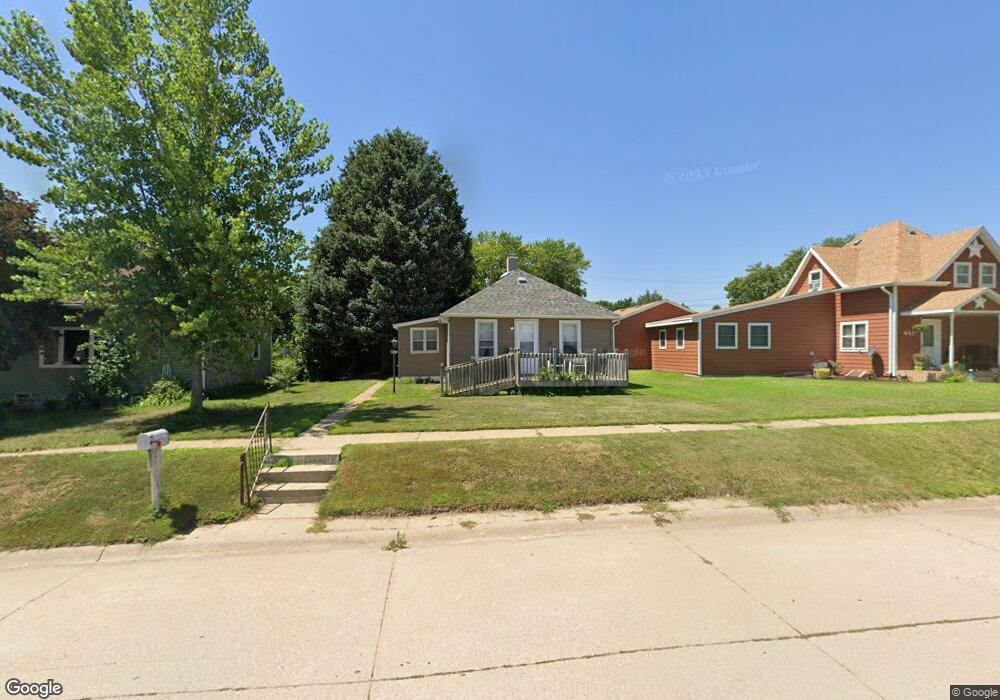
431 N 7th Ave Broken Bow, NE 68822
Estimated Value: $73,000 - $115,000
Studio
1
Bath
880
Sq Ft
$115/Sq Ft
Est. Value
About This Home
This home is located at 431 N 7th Ave, Broken Bow, NE 68822 and is currently estimated at $101,615, approximately $115 per square foot. 431 N 7th Ave is a home located in Custer County with nearby schools including North Park Elementary School, Broken Bow Junior High School, and Broken Bow High School.
Ownership History
Date
Name
Owned For
Owner Type
Purchase Details
Closed on
Jul 8, 2024
Sold by
Garden Court Rentals Llc
Bought by
Toof Jesse
Current Estimated Value
Home Financials for this Owner
Home Financials are based on the most recent Mortgage that was taken out on this home.
Original Mortgage
$100,152
Outstanding Balance
$98,764
Interest Rate
6.94%
Mortgage Type
Construction
Estimated Equity
$2,851
Purchase Details
Closed on
Nov 30, 2010
Sold by
Mckenney Harriet
Bought by
Myers William L and Myers Darla L
Create a Home Valuation Report for This Property
The Home Valuation Report is an in-depth analysis detailing your home's value as well as a comparison with similar homes in the area
Home Values in the Area
Average Home Value in this Area
Purchase History
| Date | Buyer | Sale Price | Title Company |
|---|---|---|---|
| Toof Jesse | $102,000 | Russell Title & Escrow Co | |
| Myers William L | $35,000 | -- |
Source: Public Records
Mortgage History
| Date | Status | Borrower | Loan Amount |
|---|---|---|---|
| Open | Toof Jesse | $100,152 |
Source: Public Records
Tax History
| Year | Tax Paid | Tax Assessment Tax Assessment Total Assessment is a certain percentage of the fair market value that is determined by local assessors to be the total taxable value of land and additions on the property. | Land | Improvement |
|---|---|---|---|---|
| 2025 | $1,125 | $88,112 | $7,706 | $80,406 |
| 2024 | $854 | $63,685 | $7,706 | $55,979 |
| 2023 | $1,032 | $65,877 | $7,706 | $58,171 |
| 2022 | $1,120 | $61,048 | $7,706 | $53,342 |
| 2021 | $1,086 | $60,566 | $7,224 | $53,342 |
| 2020 | $1,077 | $60,566 | $7,224 | $53,342 |
| 2019 | $949 | $53,445 | $3,612 | $49,833 |
| 2017 | $707 | $38,728 | $3,612 | $35,116 |
| 2016 | $749 | $37,476 | $2,360 | $35,116 |
| 2015 | $733 | $36,395 | $2,332 | $34,063 |
| 2014 | $733 | $33,086 | $2,120 | $30,966 |
Source: Public Records
Map
Nearby Homes
Your Personal Tour Guide
Ask me questions while you tour the home.