
Landlord's Agent in 2015
Jennifer Rivera
Blue and Gray Realty, LLC
(304) 952-8735
1 in this area
92 Total Sales
Estimated Value: $387,000 - $423,000
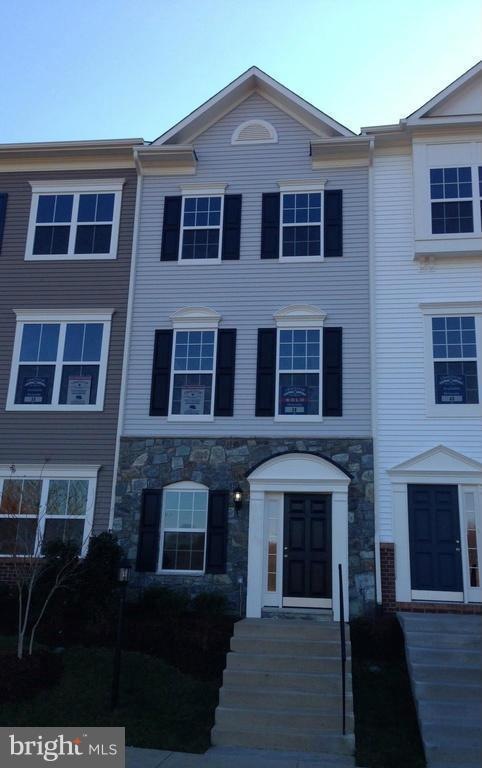
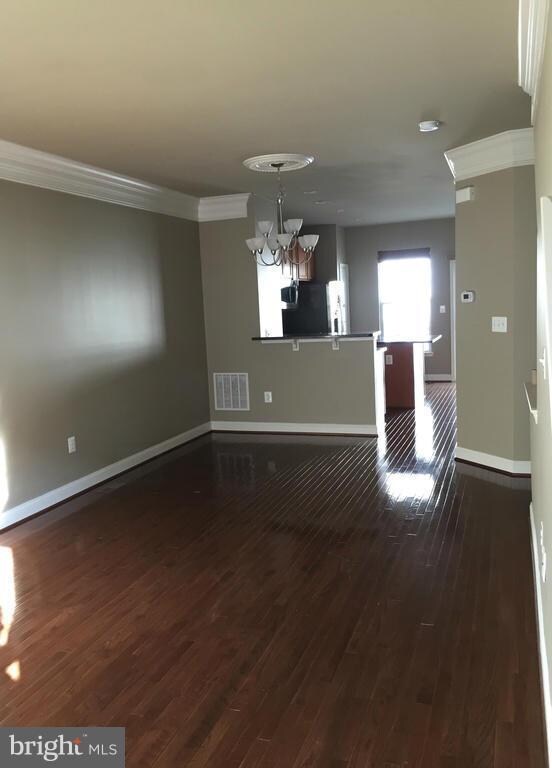
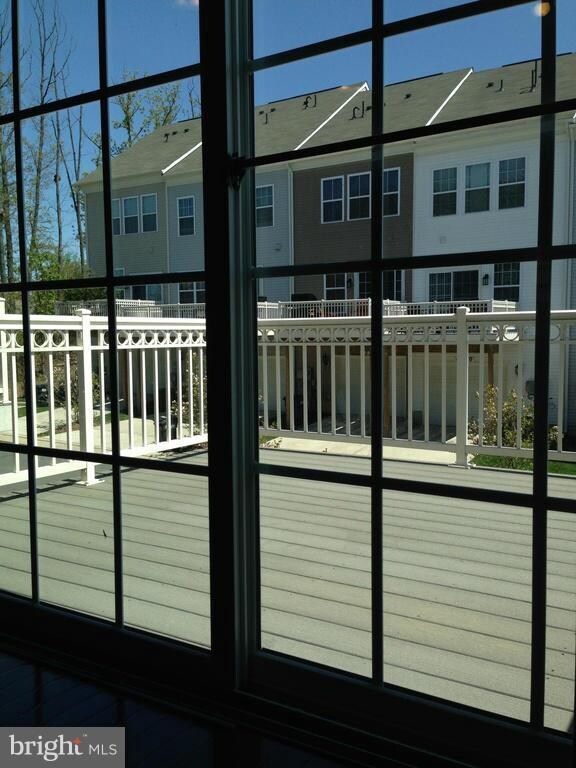
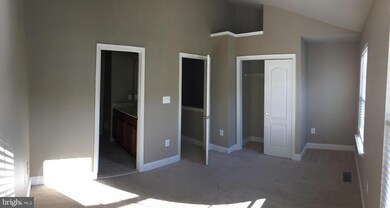
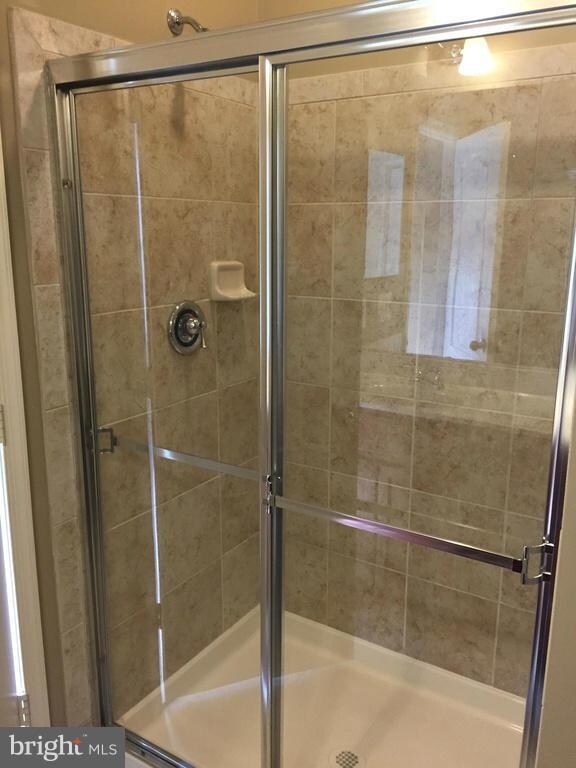
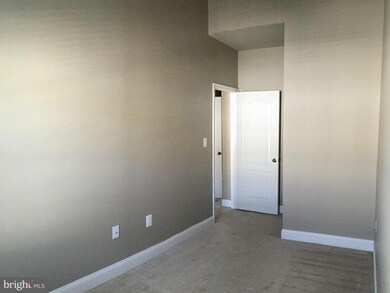
Beautifully maintained townhome. Gourmet kitchen w/granite countertops, stainless steel appliances, center island & eat in kitchen that leads to rear deck. Main level w hardwood floors, crown molding & lots of windows. Upper & lower level have ww carpeting. Fully finished basement. Community pool. Water, sewer & lawn service included. Mins to I-95, commuter lots & less than 2 miles to Quantico.
Last Agent to Rent the Property
(540) 308-5199 quanticorealtygroup@gmail.com Blue and Gray Realty, LLC License #0225194739 Listed on: 05/11/2015
We collect this data history from publicly available records. To have your information removed, we recommend requesting removal directly through your county’s website.
| Date | Buyer | Sale Price | Title Company |
|---|---|---|---|
| Dye Derrin | $269,500 | -- | |
| Ramos Liliana B | $240,900 | -- |
We collect this data history from publicly available records. To have your information removed, we recommend requesting removal directly through your county’s website.
| Date | Status | Borrower | Loan Amount |
|---|---|---|---|
| Open | Dye Derrin | $264,618 | |
| Closed | Dye Derrin | -- | |
| Previous Owner | Ramos Liliana B | $240,900 |
| Date | Event | Price | List to Sale | Price per Sq Ft |
|---|---|---|---|---|
| 05/13/2015 05/13/15 | Rented | $1,850 | 0.0% | -- |
| 05/13/2015 05/13/15 | Under Contract | -- | -- | -- |
| 05/11/2015 05/11/15 | For Rent | $1,850 | -- | -- |
| Year | Tax Paid | Tax Assessment Tax Assessment Total Assessment is a certain percentage of the fair market value that is determined by local assessors to be the total taxable value of land and additions on the property. | Land | Improvement |
|---|---|---|---|---|
| 2025 | $3,424 | $376,100 | $114,800 | $261,300 |
| 2024 | $3,424 | $344,300 | $105,300 | $239,000 |
| 2023 | $3,364 | $323,300 | $98,400 | $224,900 |
| 2022 | $3,389 | $306,000 | $92,800 | $213,200 |
| 2021 | $3,502 | $286,100 | $86,700 | $199,400 |
| 2020 | $4,183 | $269,900 | $81,000 | $188,900 |
| 2019 | $3,993 | $257,600 | $77,100 | $180,500 |
| 2018 | $3,096 | $256,400 | $77,100 | $179,300 |
| 2017 | $3,148 | $254,500 | $76,300 | $178,200 |
| 2016 | $3,224 | $263,400 | $78,700 | $184,700 |
| 2015 | $3,070 | $273,800 | $81,500 | $192,300 |
| 2014 | $3,070 | $245,200 | $72,800 | $172,400 |
Landlord's Agent in 2015
Jennifer Rivera
Blue and Gray Realty, LLC
(304) 952-8735
1 in this area
92 Total Sales
Tenant's Agent in 2015
Loretta Rossomondo
EXP Realty, LLC
(703) 405-0601
1 in this area
54 Total Sales
Source: Bright MLS
MLS Number: 1000240751
APN: 8188-57-4972.01
Disclaimer: Certain information contained herein is derived from information provided by parties other than Homes.com. All information provided is deemed reliable, but is not guaranteed to be accurate and should be independently verified.
![]() The data relating to real estate for sale on this website appears in part through the BRIGHT Internet Data Exchange program, a voluntary cooperative exchange of property listing data between licensed real estate brokerage firms, and is provided by BRIGHT through a licensing agreement.
The data relating to real estate for sale on this website appears in part through the BRIGHT Internet Data Exchange program, a voluntary cooperative exchange of property listing data between licensed real estate brokerage firms, and is provided by BRIGHT through a licensing agreement.
Listing information is from various brokers who participate in the Bright MLS IDX program and not all listings may be visible on the site.
The property information being provided on or through the website is for the personal, non-commercial use of consumers and such information may not be used for any purpose other than to identify prospective properties consumers may be interested in purchasing.
Some properties which appear for sale on the website may no longer be available because they are for instance, under contract, sold or are no longer being offered for sale.
Property information displayed is deemed reliable but is not guaranteed.
Copyright 2026 Bright MLS, Inc.
Ask me questions while you tour the home.