Estimated Value: $623,000 - $679,000
5
Beds
3
Baths
2,031
Sq Ft
$324/Sq Ft
Est. Value
About This Home
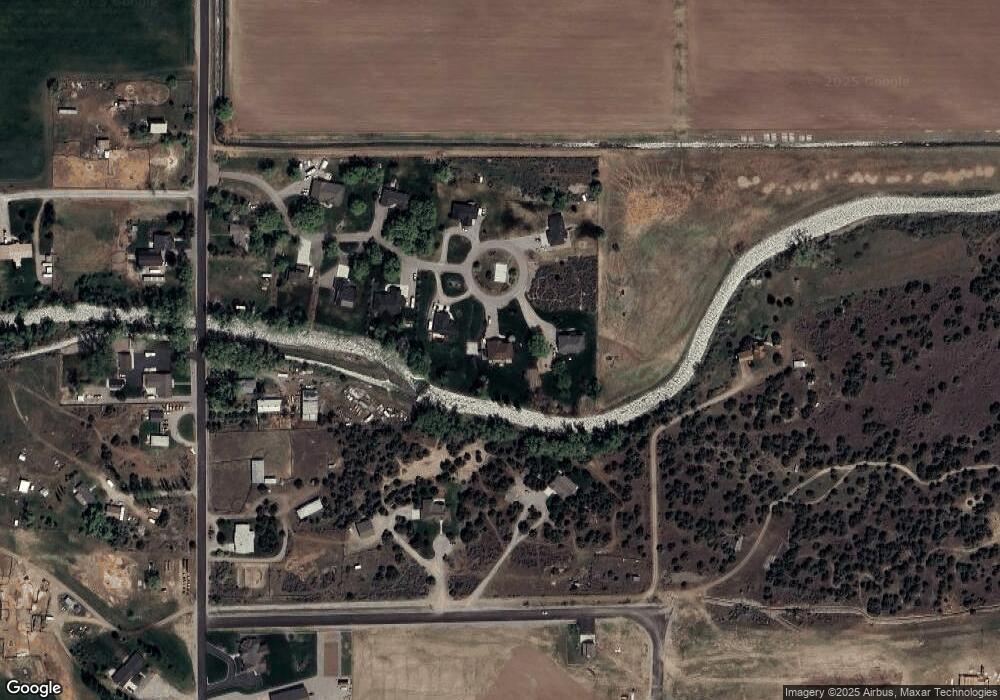
This home is located at 4318 E 265 N, Rigby, ID 83442 and is currently estimated at $657,303, approximately $323 per square foot. 4318 E 265 N is a home with nearby schools including South Fork Elementary School, Rigby Middle School, and Rigby High School.
Ownership History
Date
Name
Owned For
Owner Type
Purchase Details
Closed on
Sep 23, 2022
Sold by
I Buy Idaho Llc
Bought by
Plars Llc
Current Estimated Value
Purchase Details
Closed on
Jan 28, 2021
Sold by
Vangallup Galen and Gallup Thomas Grant
Bought by
Peterson Morgan J and Peterson Lacie L
Purchase Details
Closed on
Jun 18, 2020
Sold by
Peterson Lacie and Peterson Morgan
Bought by
Peterson Morgan
Home Financials for this Owner
Home Financials are based on the most recent Mortgage that was taken out on this home.
Original Mortgage
$325,000
Interest Rate
3.2%
Mortgage Type
New Conventional
Purchase Details
Closed on
Mar 14, 2011
Sold by
Aurora Loan Services Llc
Bought by
Peterson Morgan
Home Financials for this Owner
Home Financials are based on the most recent Mortgage that was taken out on this home.
Original Mortgage
$205,000
Interest Rate
5.02%
Mortgage Type
Unknown
Purchase Details
Closed on
Mar 25, 2010
Sold by
Riverwood Development Llc
Bought by
Peterson Morgan and Peterson Lacie
Create a Home Valuation Report for This Property
The Home Valuation Report is an in-depth analysis detailing your home's value as well as a comparison with similar homes in the area
Home Values in the Area
Average Home Value in this Area
Purchase History
| Date | Buyer | Sale Price | Title Company |
|---|---|---|---|
| Plars Llc | -- | Title One Title | |
| Peterson Morgan J | -- | Amerititle Idaho Falls | |
| Peterson Morgan | -- | Amerititle | |
| Peterson Morgan | -- | -- | |
| Peterson Morgan | -- | Amerititle |
Source: Public Records
Mortgage History
| Date | Status | Borrower | Loan Amount |
|---|---|---|---|
| Previous Owner | Peterson Morgan | $325,000 | |
| Previous Owner | Peterson Morgan | $205,000 |
Source: Public Records
Tax History
| Year | Tax Paid | Tax Assessment Tax Assessment Total Assessment is a certain percentage of the fair market value that is determined by local assessors to be the total taxable value of land and additions on the property. | Land | Improvement |
|---|---|---|---|---|
| 2025 | $1,470 | $671,026 | $0 | $0 |
| 2024 | $1,470 | $657,143 | $0 | $0 |
| 2023 | $2,271 | $688,933 | $0 | $0 |
| 2022 | $3,330 | $601,309 | $0 | $0 |
| 2021 | $3,245 | $474,093 | $0 | $0 |
| 2020 | $2,421 | $414,054 | $0 | $0 |
| 2019 | $2,689 | $365,786 | $0 | $0 |
| 2018 | $2,387 | $322,017 | $0 | $0 |
| 2017 | $2,279 | $304,168 | $0 | $0 |
| 2016 | $2,255 | $198,714 | $0 | $0 |
| 2015 | $2,332 | $198,430 | $0 | $0 |
| 2014 | $2,516 | $214,090 | $0 | $0 |
| 2013 | -- | $186,948 | $0 | $0 |
Source: Public Records
Map
Nearby Homes
Your Personal Tour Guide
Ask me questions while you tour the home.