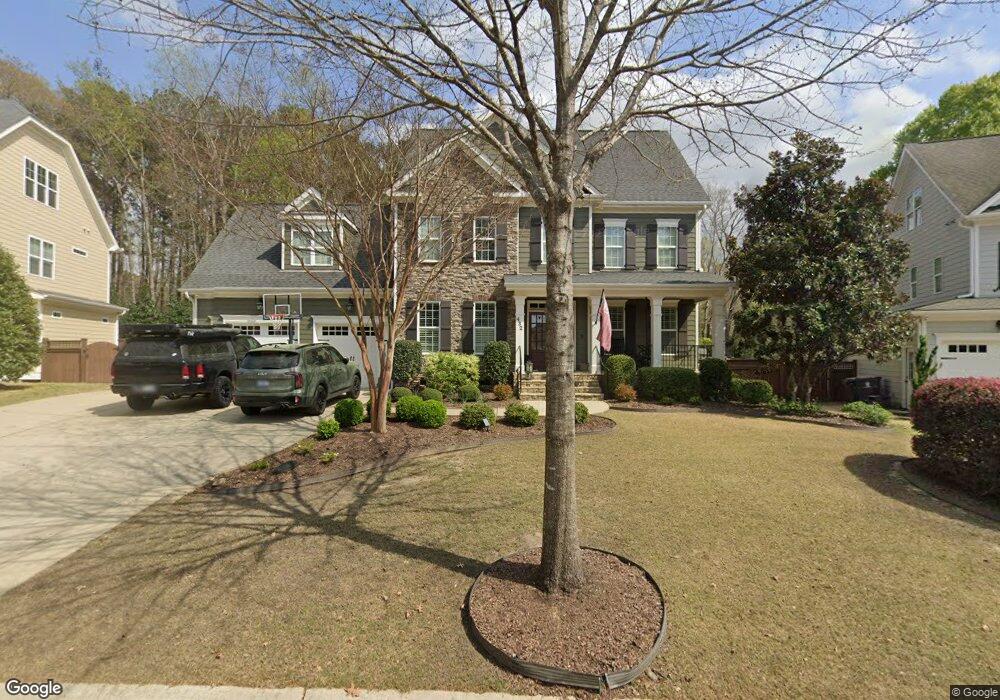
432 Wanderview Ln Holly Springs, NC 27540
Estimated Value: $826,324 - $880,000
4
Beds
4
Baths
3,353
Sq Ft
$252/Sq Ft
Est. Value
About This Home
This home is located at 432 Wanderview Ln, Holly Springs, NC 27540 and is currently estimated at $845,331, approximately $252 per square foot. 432 Wanderview Ln is a home located in Wake County with nearby schools including Middle Creek Elementary School, Holly Ridge Middle School, and Middle Creek High.
Ownership History
Date
Name
Owned For
Owner Type
Purchase Details
Closed on
Aug 20, 2018
Sold by
Green Terrance A and Green Revocable Liv Terrance A
Bought by
Green Michelle A and Green Revocable Liv Michelle M
Current Estimated Value
Purchase Details
Closed on
Nov 9, 2017
Sold by
Green Terrance A and Green Michelle M
Bought by
Green Terrance A and Green Michelle M
Purchase Details
Closed on
Aug 23, 2012
Sold by
Wmlr Inc
Bought by
Green Terrance A and Green Michelle M
Home Financials for this Owner
Home Financials are based on the most recent Mortgage that was taken out on this home.
Original Mortgage
$393,300
Outstanding Balance
$270,918
Interest Rate
3.55%
Mortgage Type
New Conventional
Estimated Equity
$574,413
Purchase Details
Closed on
Mar 6, 2012
Sold by
Sso Llc
Bought by
Wmlr Inc
Home Financials for this Owner
Home Financials are based on the most recent Mortgage that was taken out on this home.
Original Mortgage
$290,000
Interest Rate
4%
Mortgage Type
Commercial
Create a Home Valuation Report for This Property
The Home Valuation Report is an in-depth analysis detailing your home's value as well as a comparison with similar homes in the area
Home Values in the Area
Average Home Value in this Area
Purchase History
| Date | Buyer | Sale Price | Title Company |
|---|---|---|---|
| Green Michelle A | -- | None Available | |
| Green Terrance A | -- | None Available | |
| Green Terrance A | $429,000 | None Available | |
| Wmlr Inc | $60,000 | None Available |
Source: Public Records
Mortgage History
| Date | Status | Borrower | Loan Amount |
|---|---|---|---|
| Open | Green Terrance A | $393,300 | |
| Previous Owner | Wmlr Inc | $290,000 |
Source: Public Records
Tax History
| Year | Tax Paid | Tax Assessment Tax Assessment Total Assessment is a certain percentage of the fair market value that is determined by local assessors to be the total taxable value of land and additions on the property. | Land | Improvement |
|---|---|---|---|---|
| 2025 | $7,351 | $851,822 | $120,000 | $731,822 |
| 2024 | $7,320 | $851,822 | $120,000 | $731,822 |
Source: Public Records
Map
Nearby Homes
- 112 Briarburn Ln
- 525 Wanderview Ln
- 208 Brookberry Rd
- 7404 Bedford Ridge Dr
- 7320 Bedford Ridge Dr
- 225 Quarryrock Rd
- 7309 Bedford Ridge Dr
- 108 Eden Glen Dr
- 101 Sunset Oaks Dr
- 608 Skygrove Dr
- 412 Marsh Landing Dr
- 7224 Bedford Ridge Dr
- 221 Thorndale Dr
- 113 Cross Oaks Place
- 7243 Capulin Crest Dr
- 5305 Crocus Ct
- 213 Cross Oaks Place
- 316 Wescott Ridge Dr
- 3529 Brackenridge Ln
- 4829 Optimist Farm Rd
- 428 Wanderview Ln
- 436 Wanderview Ln
- 424 Wanderview Ln
- 429 Wanderview Ln
- 425 Wanderview Ln
- 433 Wanderview Ln
- 420 Wanderview Ln
- 440 Wanderview Ln
- 421 Wanderview Ln
- 444 Wanderview Ln
- 416 Wanderview Ln
- 437 Wanderview Ln
- 121 Briarburn Ln
- 117 Briarburn Ln
- 412 Wanderview Ln
- 413 Wanderview Ln
- 113 Briarburn Ln
- 144 Talicud Trail
- 452 Wanderview Ln
- 408 Wanderview Ln
Your Personal Tour Guide
Ask me questions while you tour the home.