4324 M Loop Washougal, WA 98671
Estimated Value: $640,071 - $722,000
3
Beds
4
Baths
2,561
Sq Ft
$264/Sq Ft
Est. Value
About This Home
This home is located at 4324 M Loop, Washougal, WA 98671 and is currently estimated at $675,768, approximately $263 per square foot. 4324 M Loop is a home located in Clark County with nearby schools including Columbia River Gorge Elementary School, Jemtegaard Middle School, and Washougal High School.
Ownership History
Date
Name
Owned For
Owner Type
Purchase Details
Closed on
Aug 15, 1997
Sold by
Mohr Clifford and Mohr Margaret
Bought by
Schuele Paul J and Schuele Jannette C
Current Estimated Value
Home Financials for this Owner
Home Financials are based on the most recent Mortgage that was taken out on this home.
Original Mortgage
$208,000
Outstanding Balance
$30,930
Interest Rate
7.45%
Estimated Equity
$644,838
Create a Home Valuation Report for This Property
The Home Valuation Report is an in-depth analysis detailing your home's value as well as a comparison with similar homes in the area
Purchase History
| Date | Buyer | Sale Price | Title Company |
|---|---|---|---|
| Schuele Paul J | $260,000 | Clark County Title Company |
Source: Public Records
Mortgage History
| Date | Status | Borrower | Loan Amount |
|---|---|---|---|
| Open | Schuele Paul J | $208,000 |
Source: Public Records
Tax History
| Year | Tax Paid | Tax Assessment Tax Assessment Total Assessment is a certain percentage of the fair market value that is determined by local assessors to be the total taxable value of land and additions on the property. | Land | Improvement |
|---|---|---|---|---|
| 2025 | $5,121 | $537,418 | $120,000 | $417,418 |
| 2024 | $4,960 | $539,819 | $144,000 | $395,819 |
| 2023 | $4,845 | $547,234 | $154,800 | $392,434 |
| 2022 | $4,820 | $523,505 | $154,800 | $368,705 |
| 2021 | $4,673 | $451,915 | $132,000 | $319,915 |
| 2020 | $4,470 | $411,074 | $120,000 | $291,074 |
| 2019 | $3,411 | $399,446 | $120,000 | $279,446 |
| 2018 | $4,886 | $322,187 | $0 | $0 |
| 2017 | $3,814 | $381,115 | $0 | $0 |
| 2016 | $3,879 | $326,660 | $0 | $0 |
Source: Public Records
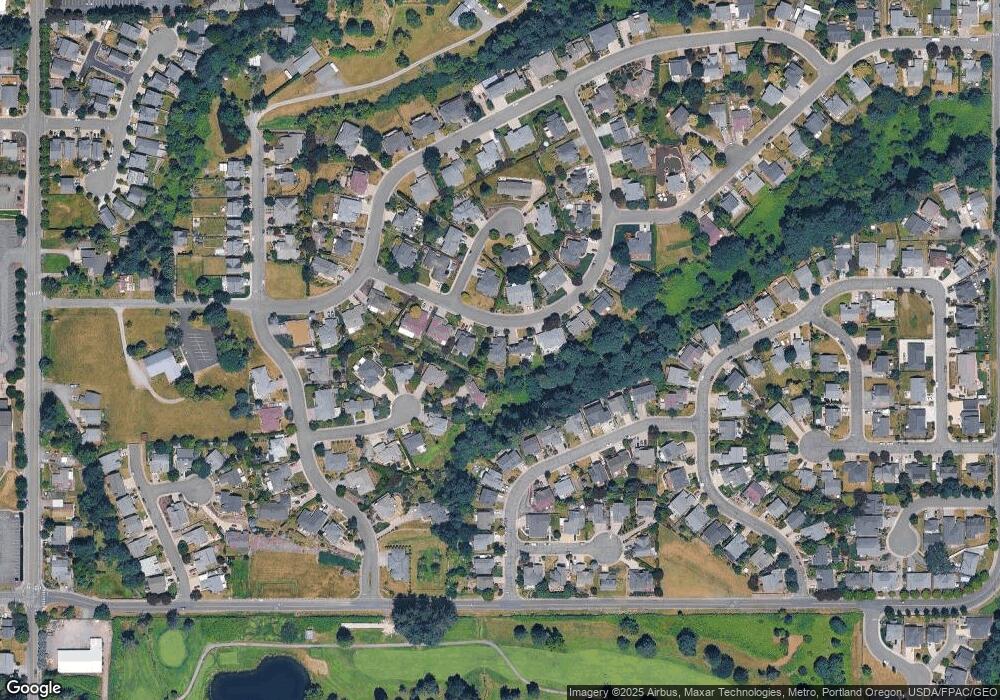
Map
Nearby Homes
Your Personal Tour Guide
Ask me questions while you tour the home.