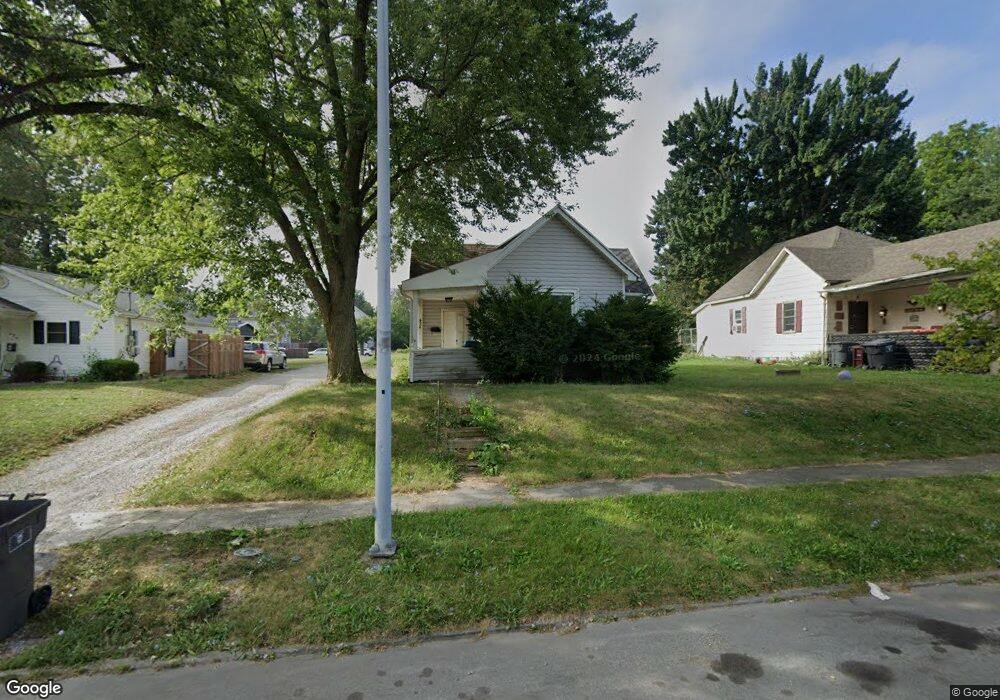
434 E Mckibben St Lima, OH 45801
Eastside Lima NeighborhoodEstimated Value: $72,000 - $91,000
2
Beds
1
Bath
960
Sq Ft
$83/Sq Ft
Est. Value
About This Home
This home is located at 434 E Mckibben St, Lima, OH 45801 and is currently estimated at $79,864, approximately $83 per square foot. 434 E Mckibben St is a home located in Allen County with nearby schools including Independence Elementary School, Lima North Middle School, and Lima West Middle School.
Ownership History
Date
Name
Owned For
Owner Type
Purchase Details
Closed on
Jun 28, 1995
Sold by
Saegers Anita
Bought by
Elrod Charles and Jakeway Kimberlie
Current Estimated Value
Home Financials for this Owner
Home Financials are based on the most recent Mortgage that was taken out on this home.
Original Mortgage
$30,400
Interest Rate
7.88%
Mortgage Type
New Conventional
Purchase Details
Closed on
Jan 1, 1981
Bought by
Saegers Anita E
Create a Home Valuation Report for This Property
The Home Valuation Report is an in-depth analysis detailing your home's value as well as a comparison with similar homes in the area
Home Values in the Area
Average Home Value in this Area
Purchase History
| Date | Buyer | Sale Price | Title Company |
|---|---|---|---|
| Elrod Charles | $38,000 | -- | |
| Saegers Anita E | -- | -- |
Source: Public Records
Mortgage History
| Date | Status | Borrower | Loan Amount |
|---|---|---|---|
| Closed | Elrod Charles | $30,400 |
Source: Public Records
Tax History
| Year | Tax Paid | Tax Assessment Tax Assessment Total Assessment is a certain percentage of the fair market value that is determined by local assessors to be the total taxable value of land and additions on the property. | Land | Improvement |
|---|---|---|---|---|
| 2024 | $377 | $18,870 | $3,750 | $15,120 |
| 2023 | $645 | $14,840 | $2,940 | $11,900 |
| 2022 | $648 | $14,840 | $2,940 | $11,900 |
| 2021 | $685 | $14,840 | $2,940 | $11,900 |
| 2020 | $664 | $12,710 | $2,840 | $9,870 |
| 2019 | $664 | $12,710 | $2,840 | $9,870 |
| 2018 | $657 | $12,710 | $2,840 | $9,870 |
| 2017 | $666 | $12,710 | $2,840 | $9,870 |
| 2016 | $676 | $12,710 | $2,840 | $9,870 |
| 2015 | $700 | $12,710 | $2,840 | $9,870 |
| 2014 | $700 | $13,030 | $2,770 | $10,260 |
| 2013 | $682 | $13,030 | $2,770 | $10,260 |
Source: Public Records
Map
Nearby Homes
- 129 S Pine St
- 922 N Jefferson St
- 145 S Pine St
- 616-616.5 N Elizabeth St
- 626 E Elm St
- 217 Harrison Ave
- 735 N Elizabeth St
- 919 N Main St
- 610 Linden St
- 124 N Perry St
- 325 N McDonel St
- 1210 E Market St
- 416 Hazel Ave
- 817 E Eureka St
- 316 Ewing Ave
- 435 Marian Ave
- 631 Brice Ave
- 406 Ewing Ave
- 431 N Metcalf St
- 471 Mc Pheron Ave
- 434 E Mckibben St
- 432 E Mckibben St
- 436 E Mckibben St
- 430 E Mckibben St
- 433 E Pearl St Unit 435
- 431 E Pearl St
- 441 E Pearl St
- 435 E Pearl St
- 425 E Pearl St
- 447 E Pearl St
- 428 E Mckibben St
- 438 E Mckibben St
- 440 E Mckibben St
- 440 E Mckibben St
- 435 E Mckibben St
- 431 E Mckibben St
- 437 E Mckibben St
- 427 E Mckibben St
- 449 E Pearl St
Your Personal Tour Guide
Ask me questions while you tour the home.