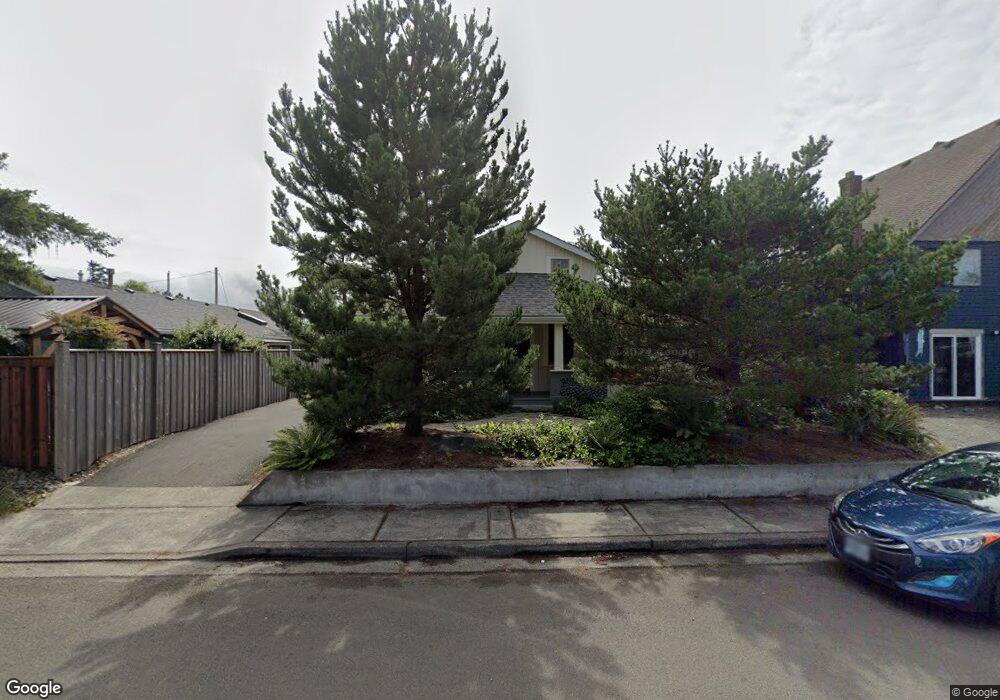
435 Ave S Seaside, OR 97138
Cartwright Park NeighborhoodEstimated Value: $517,000 - $688,000
About This Home
This home is located at 435 Ave S, Seaside, OR 97138 and is currently estimated at $594,037, approximately $419 per square foot. 435 Ave S is a home located in Clatsop County with nearby schools including Seaside High School.
Ownership History
We collect this data history from publicly available records. To have your information removed, we recommend requesting removal directly through your county’s website.
Purchase Details
Purchase Details
Purchase Details
Home Financials for this Owner
Home Financials are based on the most recent Mortgage that was taken out on this home.Home Values in the Area
Average Home Value in this Area
Purchase History
We collect this data history from publicly available records. To have your information removed, we recommend requesting removal directly through your county’s website.
| Date | Buyer | Sale Price | Title Company |
|---|---|---|---|
| $77,500 | Service Link | ||
| $169,900 | None Available | ||
| $290,000 | Ticor Title Ins Co |
Mortgage History
We collect this data history from publicly available records. To have your information removed, we recommend requesting removal directly through your county’s website.
| Date | Status | Borrower | Loan Amount |
|---|---|---|---|
| Previous Owner | $72,500 | ||
| Previous Owner | $203,000 |
Tax History
We collect this data history from publicly available records. To have your information removed, we recommend requesting removal directly through your county’s website.
| Year | Tax Paid | Tax Assessment Tax Assessment Total Assessment is a certain percentage of the fair market value that is determined by local assessors to be the total taxable value of land and additions on the property. | Land | Improvement |
|---|---|---|---|---|
| 2025 | $3,511 | $244,309 | -- | -- |
| 2024 | $3,407 | $237,195 | -- | -- |
| 2023 | $2,924 | $203,602 | $0 | $0 |
| 2022 | $2,844 | $197,673 | $0 | $0 |
| 2021 | $2,783 | $191,916 | $0 | $0 |
| 2020 | $2,719 | $186,327 | $0 | $0 |
| 2019 | $2,644 | $180,901 | $0 | $0 |
| 2018 | $2,539 | $175,633 | $0 | $0 |
| 2017 | $2,424 | $170,518 | $0 | $0 |
| 2016 | $2,132 | $165,553 | $77,127 | $88,426 |
| 2015 | $2,076 | $160,732 | $74,881 | $85,851 |
| 2014 | $1,891 | $142,562 | $0 | $0 |
| 2013 | -- | $138,411 | $0 | $0 |
Map
- 2149 S Franklin St
- 1761 S Edgewood St
- 1715 S Franklin St
- 1658 S Edgewood St
- 2685 S Roosevelt Dr
- 2100 S Roosevelt Dr
- 1386 Avenue U Unit 1
- 1386 U Ave
- 2233 Beach Dr Unit 40
- 150 Avenue U
- 1577 S Franklin St
- 40 Avenue U
- 40 Avenue U Unit 63
- 40 Avenue U Unit 61
- 1480 S Edgewood St
- 40 Ave U Unit 61
- 2316 Beach Dr Unit 157
- 0 Avenue S Unit Lot 29W
- 0 Avenue S Unit Lot 29E
- 0 Avenue S
- 2036 S Franklin St
- 2060 S Franklin St
- 1960 S Franklin St
- 440 Avenue T
- 1940 S Franklin St
- 2061 S Franklin St
- 420 Avenue T
- 2061 S Franklin Ave
- 2024 S Edgewood St
- 400 Ave T
- 400 Avenue T
- 1920 S Franklin St
- 530 Avenue T
- 1921 S Edgewood St
- 1860 S Franklin St # 5
- 1860 S Franklin Unit 1
- 1860 S Franklin St Unit 1
- 1860 S Franklin St
- 1860 S Franklin St Unit 5
- 2020 S Edgewood St
Ask me questions while you tour the home.