435 Cambridge St Cambridge, MA 02141
East Cambridge NeighborhoodEstimated Value: $1,130,909
About This Home
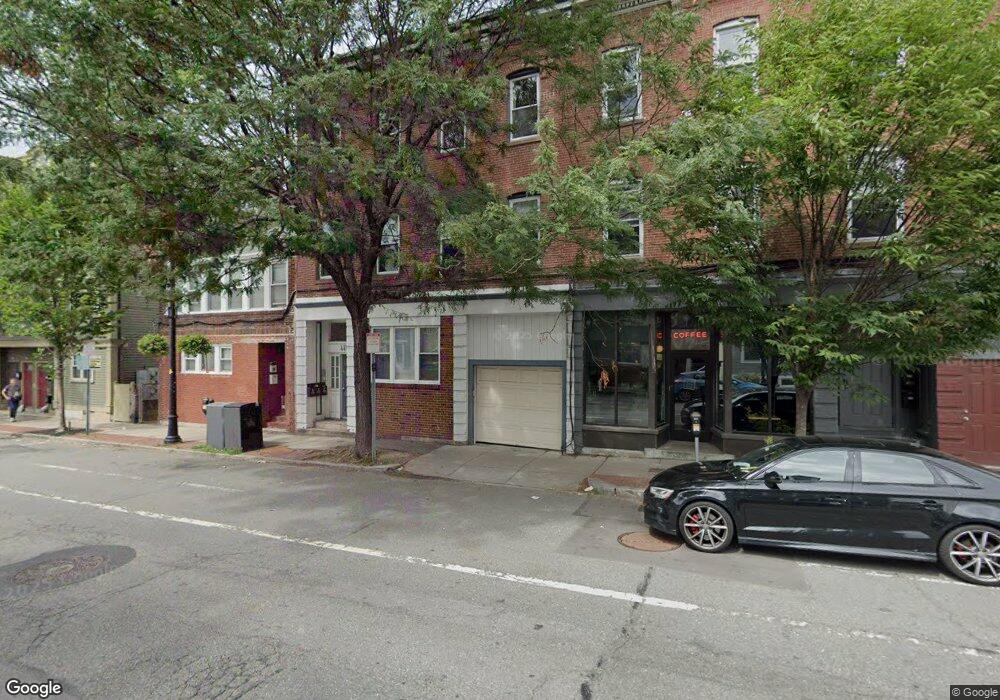
This home is located at 435 Cambridge St, Cambridge, MA 02141 and is currently estimated at $1,130,909, approximately $523 per square foot. 435 Cambridge St is a home located in Middlesex County with nearby schools including Prospect Hill Academy Charter School and Community Charter School of Cambridge.
Ownership History
We collect this data history from publicly available records. To have your information removed, we recommend requesting removal directly through your county’s website.
Purchase Details
Home Financials for this Owner
Home Financials are based on the most recent Mortgage that was taken out on this home.Home Values in the Area
Average Home Value in this Area
Purchase History
We collect this data history from publicly available records. To have your information removed, we recommend requesting removal directly through your county’s website.
| Date | Buyer | Sale Price | Title Company |
|---|---|---|---|
| $290,000 | -- |
Mortgage History
We collect this data history from publicly available records. To have your information removed, we recommend requesting removal directly through your county’s website.
| Date | Status | Borrower | Loan Amount |
|---|---|---|---|
| Open | $217,500 |
Tax History
We collect this data history from publicly available records. To have your information removed, we recommend requesting removal directly through your county’s website.
| Year | Tax Paid | Tax Assessment Tax Assessment Total Assessment is a certain percentage of the fair market value that is determined by local assessors to be the total taxable value of land and additions on the property. | Land | Improvement |
|---|---|---|---|---|
| 2025 | -- | $1,117,700 | $499,200 | $618,500 |
| 2024 | -- | $1,130,100 | $546,700 | $583,400 |
| 2023 | $0 | $1,100,100 | $509,400 | $590,700 |
| 2022 | $0 | $1,036,100 | $537,400 | $498,700 |
| 2021 | $0 | $1,085,600 | $515,900 | $569,700 |
| 2020 | $7,662 | $987,200 | $519,800 | $467,400 |
| 2019 | $4,285 | $887,200 | $509,800 | $377,400 |
| 2018 | $3,155 | $789,600 | $422,800 | $366,800 |
| 2017 | -- | $706,800 | $378,000 | $328,800 |
| 2016 | -- | $610,000 | $295,900 | $314,100 |
| 2015 | -- | $530,800 | $253,700 | $277,100 |
| 2014 | -- | $491,100 | $196,500 | $294,600 |
Map
- 32 5th St Unit 1
- 262 Monsignor Obrien Hwy Unit 503
- 170 Gore St Unit 113
- 170 Gore St Unit 417
- 104 Thorndike St Unit 1
- 104 Thorndike St Unit 2
- 138 Thorndike St
- 93 Third St
- 11 8th St Unit 1
- 11 8th St Unit 2
- 110 Spring St
- 64-66 Sixth St Unit 1
- 241 Hurley St Unit 1
- 30 2nd St Unit 2
- 9 Medford St Unit 405
- 9 Medford St Unit 410
- 169 Monsignor Obrien Hwy Unit 513
- 218 Thorndike St Unit 108
- 131 Charles St
- 71 Fulkerson St Unit 210
- 32 5th St Unit 2
- 32 5th St
- 32 5th St
- 34 5th St Unit 2
- 34 5th St Unit 1
- 110 Gore Street - 112
- 112 Gore St Unit 2
- 112 Gore St Unit 1
- 112 Gore St Unit 3
- 110 Gore St
- 38 5th St
- 36 5th St Unit 2
- 108 Gore St Unit 4
- 108 Gore St Unit 3
- 108 Gore St Unit 2
- 108 Gore St Unit 1
- 108 Gore St Unit 108
- 108 Gore St
- 44 5th St
- 33 5th St
Ask me questions while you tour the home.