Estimated Value: $232,205 - $300,000
About This Home
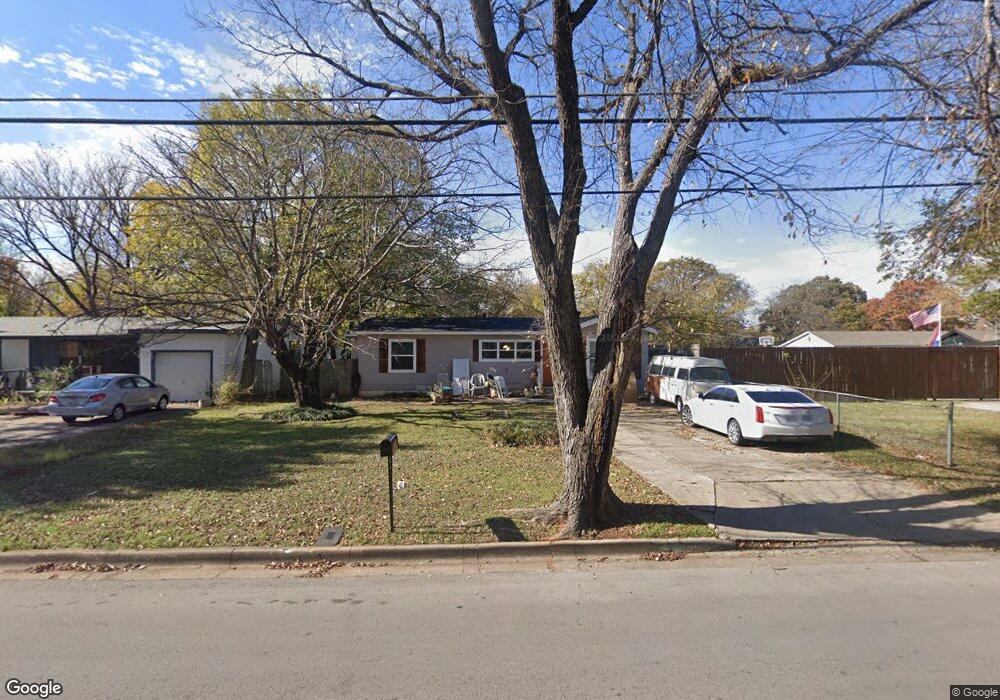
This home is located at 435 Hurstview Dr, Hurst, TX 76053 and is currently estimated at $254,051, approximately $226 per square foot. 435 Hurstview Dr is a home located in Tarrant County with nearby schools including West Hurst Elementary School, Hurst J High School, and L.D. Bell High School.
Ownership History
We collect this data history from publicly available records. To have your information removed, we recommend requesting removal directly through your county’s website.
Purchase Details
Home Financials for this Owner
Home Financials are based on the most recent Mortgage that was taken out on this home.Purchase Details
Home Financials for this Owner
Home Financials are based on the most recent Mortgage that was taken out on this home.Home Values in the Area
Average Home Value in this Area
Purchase History
We collect this data history from publicly available records. To have your information removed, we recommend requesting removal directly through your county’s website.
| Date | Buyer | Sale Price | Title Company |
|---|---|---|---|
| -- | Atd | ||
| -- | Alamo Title Company |
Mortgage History
We collect this data history from publicly available records. To have your information removed, we recommend requesting removal directly through your county’s website.
| Date | Status | Borrower | Loan Amount |
|---|---|---|---|
| Open | $175,757 | ||
| Previous Owner | $118,700 |
Tax History
We collect this data history from publicly available records. To have your information removed, we recommend requesting removal directly through your county’s website.
| Year | Tax Paid | Tax Assessment Tax Assessment Total Assessment is a certain percentage of the fair market value that is determined by local assessors to be the total taxable value of land and additions on the property. | Land | Improvement |
|---|---|---|---|---|
| 2025 | $4,164 | $197,904 | $50,000 | $147,904 |
| 2024 | $4,700 | $230,122 | $50,000 | $180,122 |
| 2023 | $4,766 | $237,909 | $35,000 | $202,909 |
| 2022 | $4,683 | $203,413 | $35,000 | $168,413 |
| 2021 | $4,374 | $181,373 | $35,000 | $146,373 |
| 2020 | $3,257 | $135,375 | $35,000 | $100,375 |
| 2019 | $3,116 | $127,330 | $35,000 | $92,330 |
| 2018 | $72 | $81,324 | $19,000 | $62,324 |
| 2017 | $1,871 | $93,573 | $19,000 | $74,573 |
| 2016 | $1,701 | $102,134 | $19,000 | $83,134 |
| 2015 | $11 | $61,100 | $13,500 | $47,600 |
| 2014 | $11 | $61,100 | $13,500 | $47,600 |
Map
- 431 Hurstview Dr
- 443 Hurstview Dr
- 429 Hurstview Dr
- 436 Arthur Dr
- 432 Arthur Dr
- 440 Arthur Dr
- 425 Hurstview Dr
- 436 Hurstview Dr
- 428 Arthur Dr
- 440 Hurstview Dr
- 409 W Redbud Dr
- 432 Hurstview Dr
- 444 Hurstview Dr
- 421 Hurstview Dr
- 424 Arthur Dr
- 424 Hurstview Dr
- 501 Hurstview Dr
- 420 Hurstview Dr
- 417 Hurstview Dr
- 500 Shadowbrook Ln
Ask me questions while you tour the home.