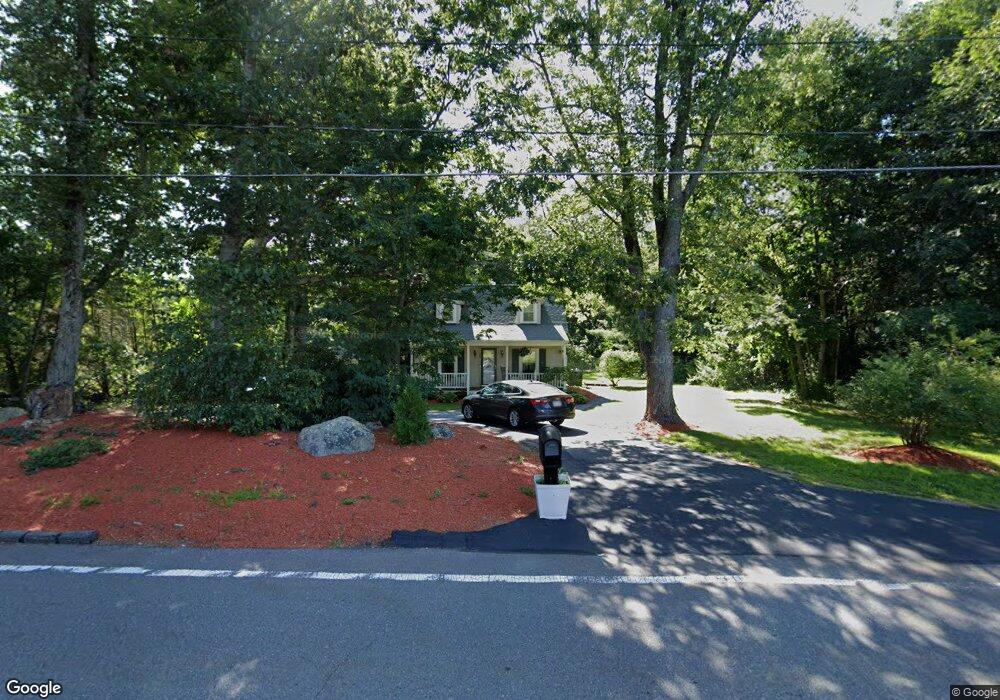
435 Main St Holden, MA 01520
Estimated Value: $462,000 - $502,000
About This Home
This home is located at 435 Main St, Holden, MA 01520 and is currently estimated at $484,980, approximately $311 per square foot. 435 Main St is a home located in Worcester County with nearby schools including Wachusett Regional High School, Bancroft School, and Holden Christian Academy.
Ownership History
We collect this data history from publicly available records. To have your information removed, we recommend requesting removal directly through your county’s website.
Purchase Details
Home Financials for this Owner
Home Financials are based on the most recent Mortgage that was taken out on this home.Purchase Details
Home Financials for this Owner
Home Financials are based on the most recent Mortgage that was taken out on this home.Home Values in the Area
Average Home Value in this Area
Purchase History
We collect this data history from publicly available records. To have your information removed, we recommend requesting removal directly through your county’s website.
| Date | Buyer | Sale Price | Title Company |
|---|---|---|---|
| $149,900 | -- | ||
| $130,000 | -- |
Mortgage History
We collect this data history from publicly available records. To have your information removed, we recommend requesting removal directly through your county’s website.
| Date | Status | Borrower | Loan Amount |
|---|---|---|---|
| Open | $134,910 | ||
| Previous Owner | $117,000 | ||
| Previous Owner | $60,000 | ||
| Previous Owner | $22,000 |
Tax History
We collect this data history from publicly available records. To have your information removed, we recommend requesting removal directly through your county’s website.
| Year | Tax Paid | Tax Assessment Tax Assessment Total Assessment is a certain percentage of the fair market value that is determined by local assessors to be the total taxable value of land and additions on the property. | Land | Improvement |
|---|---|---|---|---|
| 2025 | $5,687 | $410,300 | $132,400 | $277,900 |
| 2024 | $5,227 | $369,400 | $128,500 | $240,900 |
| 2023 | $4,926 | $328,600 | $111,700 | $216,900 |
| 2022 | $4,738 | $286,100 | $87,200 | $198,900 |
| 2021 | $4,594 | $264,000 | $83,100 | $180,900 |
| 2020 | $4,396 | $258,600 | $79,200 | $179,400 |
| 2019 | $4,225 | $242,100 | $79,200 | $162,900 |
| 2018 | $4,077 | $231,500 | $75,400 | $156,100 |
| 2017 | $3,784 | $215,100 | $75,400 | $139,700 |
| 2016 | $3,545 | $205,500 | $71,800 | $133,700 |
| 2015 | $3,615 | $199,500 | $71,800 | $127,700 |
| 2014 | $3,541 | $199,500 | $71,800 | $127,700 |
Map
- 11 Alpha Rd
- 370 Main St
- 30 Colonial Dr
- 15 Tyler Dr
- 14 Wilde Willow Dr
- 78 Tea Party Cir Unit 532
- 7 Village Green Ln
- 4 King Philip Trail Unit 601
- 253 Cranbrook Dr
- 189 Holden St
- 102 Torrey Lane Extension Unit 102
- 152 Main St
- 62 Putnam Rd
- 160 Twinbrooke Dr
- 107 Winter Hill Rd
- 55 Pine Tree Rd Unit 55
- 59 Pine Tree Rd Unit 59
- 61 Pine Tree Rd Unit 61
- 22 Pine Tree Rd Unit 22
- 24 Pine Tree Rd Unit 24
Ask me questions while you tour the home.