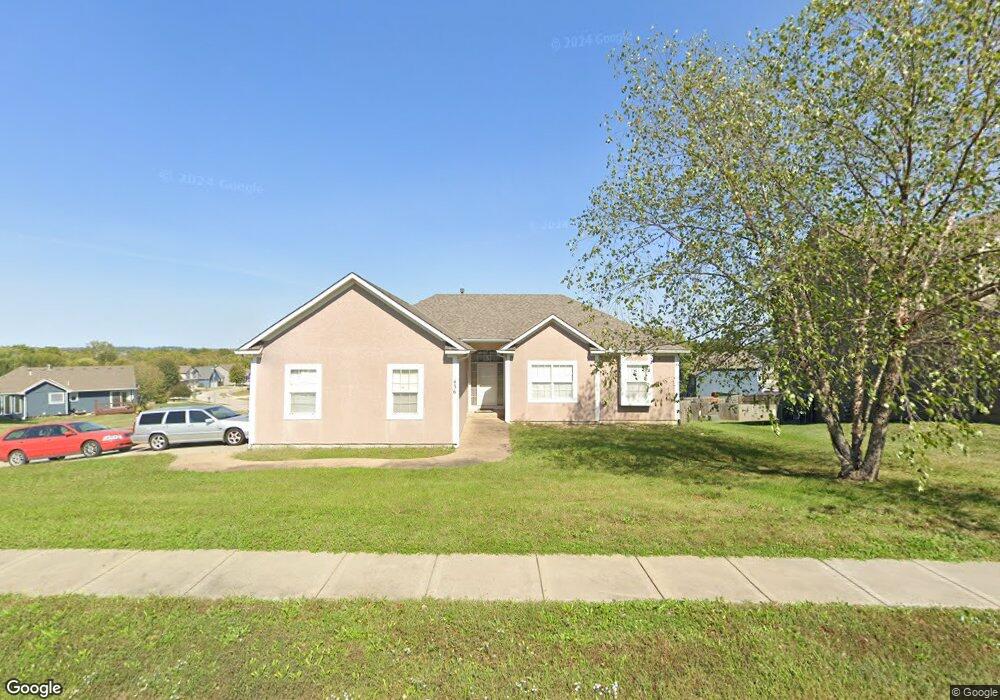
436 Spring Branch Dr Raymore, MO 64083
Estimated Value: $372,000 - $405,000
About This Home
This home is located at 436 Spring Branch Dr, Raymore, MO 64083 and is currently estimated at $391,601, approximately $237 per square foot. 436 Spring Branch Dr is a home located in Cass County with nearby schools including Creekmoor Elementary School, Raymore-Peculiar East Middle School, and Raymore-Peculiar Senior High School.
Ownership History
We collect this data history from publicly available records. To have your information removed, we recommend requesting removal directly through your county’s website.
Purchase Details
Home Financials for this Owner
Home Financials are based on the most recent Mortgage that was taken out on this home.Purchase Details
Purchase Details
Home Financials for this Owner
Home Financials are based on the most recent Mortgage that was taken out on this home.Purchase Details
Home Values in the Area
Average Home Value in this Area
Purchase History
We collect this data history from publicly available records. To have your information removed, we recommend requesting removal directly through your county’s website.
| Date | Buyer | Sale Price | Title Company |
|---|---|---|---|
| -- | None Available | ||
| -- | None Available | ||
| $137,272 | -- | ||
| -- | -- | ||
| -- | -- |
Mortgage History
We collect this data history from publicly available records. To have your information removed, we recommend requesting removal directly through your county’s website.
| Date | Status | Borrower | Loan Amount |
|---|---|---|---|
| Closed | $128,000 | ||
| Previous Owner | $200,000 |
Tax History
We collect this data history from publicly available records. To have your information removed, we recommend requesting removal directly through your county’s website.
| Year | Tax Paid | Tax Assessment Tax Assessment Total Assessment is a certain percentage of the fair market value that is determined by local assessors to be the total taxable value of land and additions on the property. | Land | Improvement |
|---|---|---|---|---|
| 2025 | $4,055 | $56,280 | $6,860 | $49,420 |
| 2024 | $4,055 | $49,890 | $6,230 | $43,660 |
| 2023 | $4,055 | $49,890 | $6,230 | $43,660 |
| 2022 | $3,597 | $43,970 | $6,230 | $37,740 |
| 2021 | $3,598 | $43,970 | $6,230 | $37,740 |
| 2020 | $3,628 | $43,550 | $6,230 | $37,320 |
| 2019 | $3,772 | $46,910 | $6,230 | $40,680 |
| 2018 | $3,452 | $41,450 | $5,150 | $36,300 |
| 2017 | $3,188 | $41,450 | $5,150 | $36,300 |
| 2016 | $3,188 | $39,740 | $5,150 | $34,590 |
| 2015 | $3,190 | $39,740 | $5,150 | $34,590 |
| 2014 | $3,192 | $39,740 | $5,150 | $34,590 |
| 2013 | -- | $39,740 | $5,150 | $34,590 |
Map
- 712 Madison Creek Ct
- 0 Madison Creek Dr
- 714 Ridge Crest Dr
- 428 Madison Creek Dr
- 715 Madison Creek Ct
- 700 Blazing Star Dr
- 613 Wild Lupine Ln
- 702 Blazing Star Dr
- 704 Blazing Star Dr
- 612 Wild Lupine Ln
- 611 Wild Lupine Ln
- 708 Blazing Star Dr
- 601 Foxglove Ln
- 602 Wild Lupine Ln
- 609 Foxglove Ln
- 613 Foxglove Ln
- 600 Wild Lupine Ln
- 611 Foxglove Ln
- 614 Foxglove Ln
- 607 Foxglove Ln
- 704 Ridge Crest Dr
- 702 Ridge Crest Dr
- 439 Madison Creek Dr
- 437 Madison Creek Dr
- 439 Spring Branch Dr
- 705 Mesa Ridge Dr
- 703 Mesa Ridge Dr
- 437 Spring Branch Dr
- 701 Mesa Ridge Dr
- 707 Ridge Crest Dr
- 435 Spring Branch Dr
- 434 Spring Branch Dr
- 433 Spring Branch Dr
- 438 Madison Creek Dr
- 440 Madison Creek Dr
- 709 Ridge Crest Dr
- 442 Madison Creek Dr
- 432 Spring Branch Dr
- 702 Mesa Ridge Dr
- 710 Madison Creek Ct
Ask me questions while you tour the home.