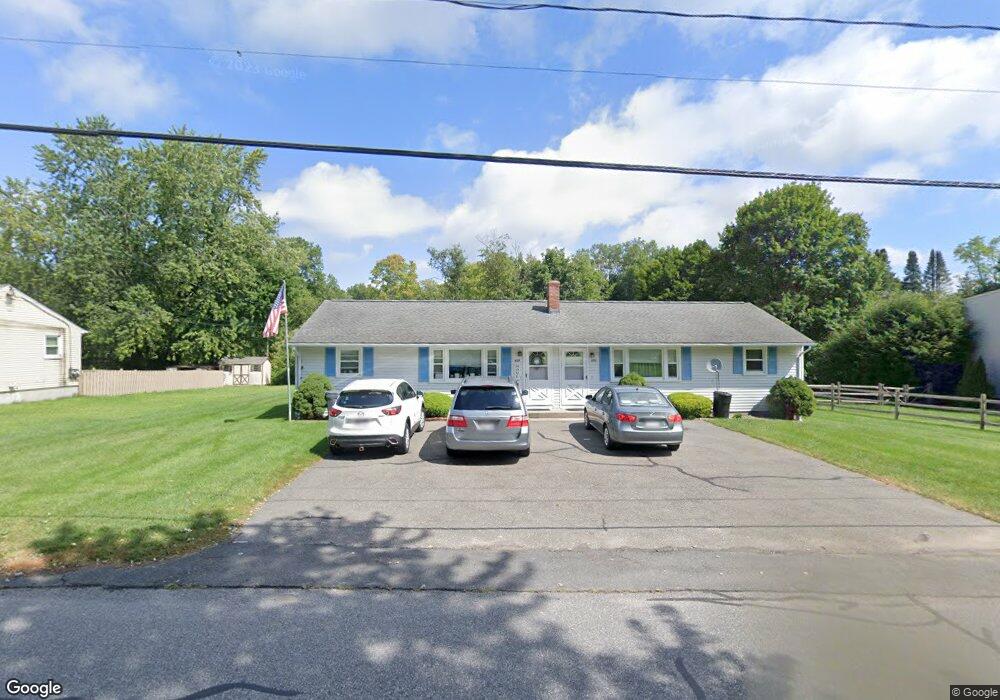
437 Poole St Unit 439 Ludlow, MA 01056
Estimated Value: $272,000 - $361,000
4
Beds
2
Baths
1,440
Sq Ft
$226/Sq Ft
Est. Value
About This Home
This home is located at 437 Poole St Unit 439, Ludlow, MA 01056 and is currently estimated at $325,249, approximately $225 per square foot. 437 Poole St Unit 439 is a home located in Hampden County with nearby schools including East Street Elementary School, Chapin Street Elementary School, and Paul R. Baird Middle School.
Ownership History
Date
Name
Owned For
Owner Type
Purchase Details
Closed on
Aug 10, 1990
Sold by
Savoia Jane K
Bought by
Alves Antonio J
Current Estimated Value
Home Financials for this Owner
Home Financials are based on the most recent Mortgage that was taken out on this home.
Original Mortgage
$77,500
Interest Rate
10.04%
Mortgage Type
Purchase Money Mortgage
Create a Home Valuation Report for This Property
The Home Valuation Report is an in-depth analysis detailing your home's value as well as a comparison with similar homes in the area
Home Values in the Area
Average Home Value in this Area
Purchase History
| Date | Buyer | Sale Price | Title Company |
|---|---|---|---|
| Alves Antonio J | $130,000 | -- | |
| Alves Antonio J | $130,000 | -- |
Source: Public Records
Mortgage History
| Date | Status | Borrower | Loan Amount |
|---|---|---|---|
| Closed | Alves Antonio J | $77,500 |
Source: Public Records
Tax History
| Year | Tax Paid | Tax Assessment Tax Assessment Total Assessment is a certain percentage of the fair market value that is determined by local assessors to be the total taxable value of land and additions on the property. | Land | Improvement |
|---|---|---|---|---|
| 2025 | $3,782 | $218,000 | $79,100 | $138,900 |
| 2024 | $3,719 | $205,600 | $80,400 | $125,200 |
| 2023 | $3,600 | $184,500 | $66,800 | $117,700 |
| 2022 | $3,598 | $180,000 | $66,800 | $113,200 |
| 2021 | $3,569 | $169,300 | $66,800 | $102,500 |
| 2020 | $3,458 | $167,700 | $65,800 | $101,900 |
| 2019 | $3,274 | $165,200 | $65,200 | $100,000 |
| 2018 | $3,302 | $173,700 | $72,400 | $101,300 |
| 2017 | $3,206 | $173,000 | $70,200 | $102,800 |
| 2016 | $3,378 | $186,300 | $68,800 | $117,500 |
| 2015 | $3,595 | $207,900 | $68,100 | $139,800 |
Source: Public Records
Map
Nearby Homes
- 10 Alden St
- 235 James St
- 30 Red Bridge Rd Land Lot 3
- 30 Red Bridge Rd Land Lot 1
- 30 Red Bridge Rd Land Lot 6
- 30 Red Bridge Rd Land Lot 8
- 30 Red Bridge Rd Land Lot 4
- 30 Red Bridge Rd Land Lot 5
- 30 Red Bridge Rd Land Lot 7
- 1172 East St
- 429 Moore St
- Lot 88 Turning Leaf Equinox Pass
- 44 Balsam Hill Rd
- 37 Balsam Hill Rd
- Lot 28 Tower Rd
- Lot B Woodland Cir
- 80 Elizabeth Dr
- 38 King Dr
- 308 Miller St Unit 79
- 308 Miller St Unit 78
Your Personal Tour Guide
Ask me questions while you tour the home.