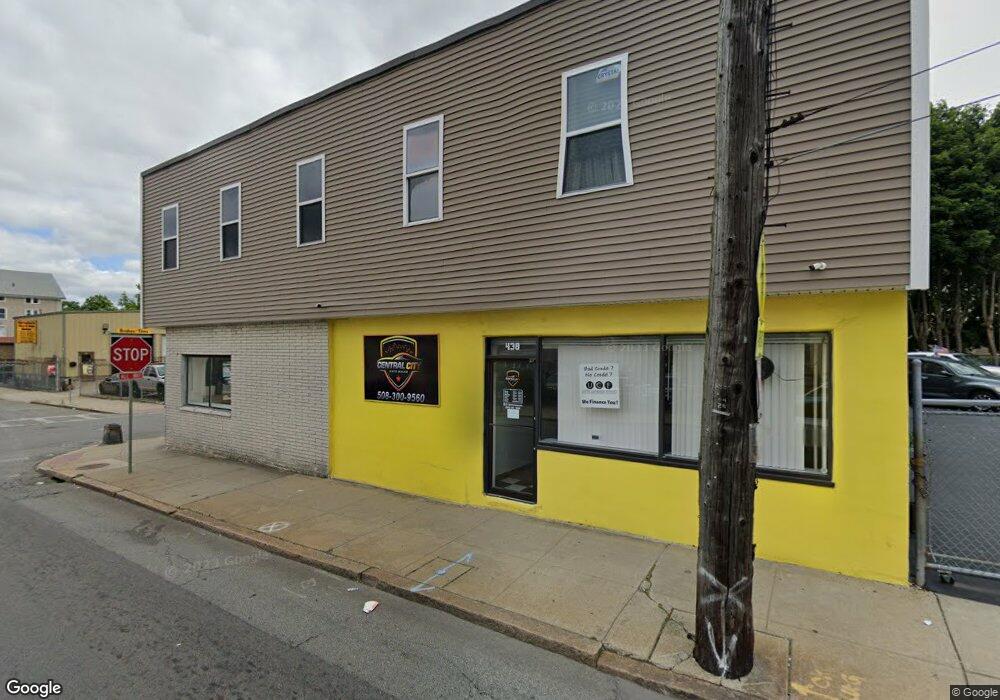
438 2nd St Unit 1 Fall River, MA 02721
Corky Row NeighborhoodEstimated Value: $865,489
Studio
--
Bath
6,595
Sq Ft
$131/Sq Ft
Est. Value
About This Home
This home is located at 438 2nd St Unit 1, Fall River, MA 02721 and is currently estimated at $865,489, approximately $131 per square foot. 438 2nd St Unit 1 is a home located in Bristol County with nearby schools including Henry Lord Community School, B M C Durfee High School, and Argosy Collegiate Charter School.
Ownership History
Date
Name
Owned For
Owner Type
Purchase Details
Closed on
Aug 20, 2003
Sold by
Sousa Ann L
Bought by
Enterprise Rt and Machado
Current Estimated Value
Create a Home Valuation Report for This Property
The Home Valuation Report is an in-depth analysis detailing your home's value as well as a comparison with similar homes in the area
Home Values in the Area
Average Home Value in this Area
Purchase History
We collect this data history from publicly available records. To have your information removed, we recommend requesting removal directly through your county’s website.
| Date | Buyer | Sale Price | Title Company |
|---|---|---|---|
| Enterprise Rt | $405,000 | -- | |
| Enterprise Rt | $405,000 | -- |
Source: Public Records
Mortgage History
We collect this data history from publicly available records. To have your information removed, we recommend requesting removal directly through your county’s website.
| Date | Status | Borrower | Loan Amount |
|---|---|---|---|
| Previous Owner | Enterprise Rt | $160,000 |
Source: Public Records
Tax History
| Year | Tax Paid | Tax Assessment Tax Assessment Total Assessment is a certain percentage of the fair market value that is determined by local assessors to be the total taxable value of land and additions on the property. | Land | Improvement |
|---|---|---|---|---|
| 2025 | $12,129 | $509,000 | $167,900 | $341,100 |
| 2024 | $11,606 | $484,800 | $160,000 | $324,800 |
| 2023 | $10,523 | $408,500 | $133,400 | $275,100 |
| 2022 | $11,042 | $408,500 | $133,400 | $275,100 |
| 2021 | $10,606 | $357,100 | $133,400 | $223,700 |
| 2020 | $10,386 | $339,300 | $123,300 | $216,000 |
| 2019 | $10,640 | $339,300 | $123,300 | $216,000 |
| 2018 | $10,466 | $336,300 | $123,300 | $213,000 |
| 2017 | $10,304 | $336,300 | $123,300 | $213,000 |
| 2016 | $9,796 | $336,300 | $123,300 | $213,000 |
| 2015 | $9,478 | $336,800 | $123,300 | $213,500 |
| 2014 | $8,986 | $336,800 | $123,300 | $213,500 |
Source: Public Records
Map
Nearby Homes
- 103 Morgan St Unit 1
- 95 Morgan St Unit 1
- 101 Morgan St Unit 2SE
- 101 Morgan St Unit 2 SW
- 101 Morgan St
- 444 2nd St
- 410 2nd St
- 100 Morgan St
- 458 2nd St Unit 1rear
- 411 2nd St
- 460 2nd St
- 427 2nd St
- 462 2nd St
- 415 2nd St
- 415-427 2nd St
- 398 2nd St
- 421 3rd St
- 470 2nd St Unit 486
- 462-470 Second
- 454 & 466 Third St
Your Personal Tour Guide
Ask me questions while you tour the home.