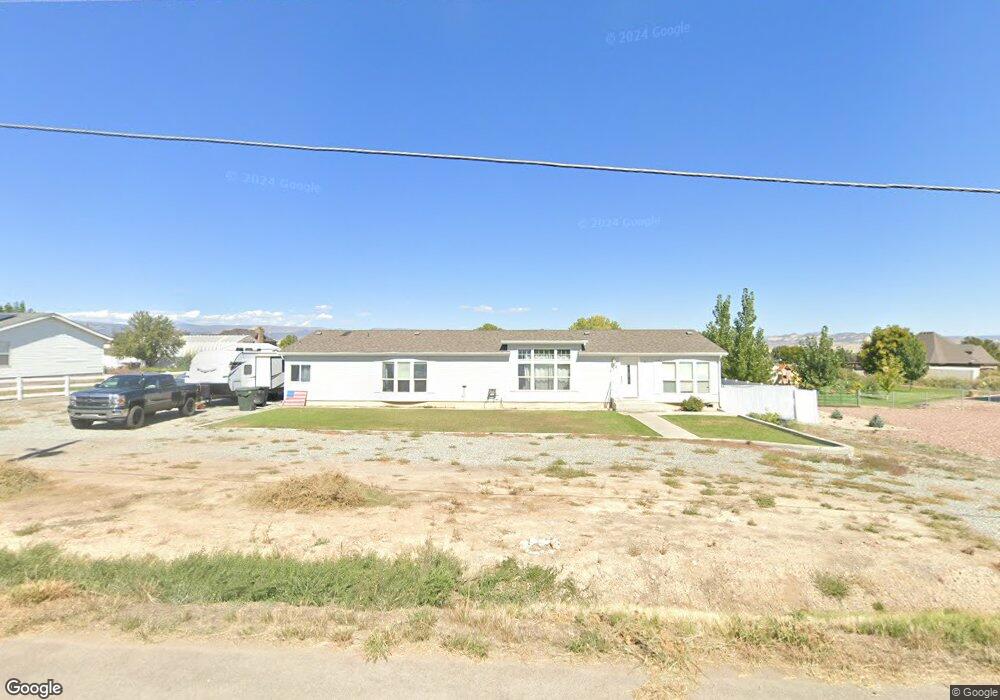
438 W 2500 S Vernal, UT 84078
Estimated Value: $347,000 - $458,000
3
Beds
2
Baths
2,356
Sq Ft
$173/Sq Ft
Est. Value
About This Home
This home is located at 438 W 2500 S, Vernal, UT 84078 and is currently estimated at $407,828, approximately $173 per square foot. 438 W 2500 S is a home located in Uintah County with nearby schools including Davis School, Vernal Middle School, and Uintah Middle School.
Ownership History
Date
Name
Owned For
Owner Type
Purchase Details
Closed on
Oct 29, 2008
Sold by
Bastian Betty Jo
Bought by
Jackson Charles D and Jackson Toni K
Current Estimated Value
Home Financials for this Owner
Home Financials are based on the most recent Mortgage that was taken out on this home.
Original Mortgage
$210,225
Outstanding Balance
$133,862
Interest Rate
6.07%
Mortgage Type
FHA
Estimated Equity
$273,966
Purchase Details
Closed on
Sep 21, 2007
Sold by
Daggett Phil N and Daggett Christina
Bought by
Bastian Betty Jo
Home Financials for this Owner
Home Financials are based on the most recent Mortgage that was taken out on this home.
Original Mortgage
$135,000
Interest Rate
6.61%
Mortgage Type
New Conventional
Create a Home Valuation Report for This Property
The Home Valuation Report is an in-depth analysis detailing your home's value as well as a comparison with similar homes in the area
Purchase History
We collect this data history from publicly available records. To have your information removed, we recommend requesting removal directly through your county’s website.
| Date | Buyer | Sale Price | Title Company |
|---|---|---|---|
| Jackson Charles D | -- | -- | |
| Bastian Betty Jo | -- | -- |
Source: Public Records
Mortgage History
We collect this data history from publicly available records. To have your information removed, we recommend requesting removal directly through your county’s website.
| Date | Status | Borrower | Loan Amount |
|---|---|---|---|
| Open | Jackson Charles D | $210,225 | |
| Previous Owner | Bastian Betty Jo | $135,000 |
Source: Public Records
Tax History
| Year | Tax Paid | Tax Assessment Tax Assessment Total Assessment is a certain percentage of the fair market value that is determined by local assessors to be the total taxable value of land and additions on the property. | Land | Improvement |
|---|---|---|---|---|
| 2025 | $1,492 | $180,789 | $29,554 | $151,235 |
| 2024 | $1,492 | $177,564 | $28,403 | $149,161 |
| 2023 | $1,492 | $168,401 | $25,532 | $142,869 |
| 2022 | $1,347 | $130,583 | $25,532 | $105,051 |
| 2021 | $1,412 | $112,351 | $25,532 | $86,819 |
| 2020 | $1,375 | $112,351 | $25,532 | $86,819 |
| 2019 | $1,236 | $99,788 | $27,500 | $72,288 |
| 2018 | $1,235 | $99,788 | $27,500 | $72,288 |
| 2017 | $12 | $102,538 | $30,250 | $72,288 |
| 2016 | $1,266 | $112,396 | $30,250 | $82,146 |
| 2015 | $1,167 | $112,396 | $30,250 | $82,146 |
| 2014 | $1,125 | $109,646 | $27,500 | $82,146 |
| 2013 | $1,149 | $109,646 | $27,500 | $82,146 |
Source: Public Records
Map
Nearby Homes
- 3297 S Vernal Ave
- 2845 S 350 W Unit 53
- 440 W 2050 S
- 466 W 2000 S
- 522 W 2000 S
- 524 W 2000 S
- 526 W 2000 S
- 182 W 2050 S
- 2887 S 350 W
- 2039 S 150 W
- 349 W 2900 S
- 3145 S 500 W
- 1902 S 35 E
- 269 E 1940 S Unit 7
- 157 E 1940 S Unit 1
- 242 E 1940 S Unit 24
- 3147 S Vernal Ave
- 2917 S 450 E
- 669 W 1500 S Unit 20
- 695 W 1500 S Unit 21
Your Personal Tour Guide
Ask me questions while you tour the home.