439 Brook St Framingham, MA 01701
Nobscot NeighborhoodEstimated Value: $487,000 - $719,694
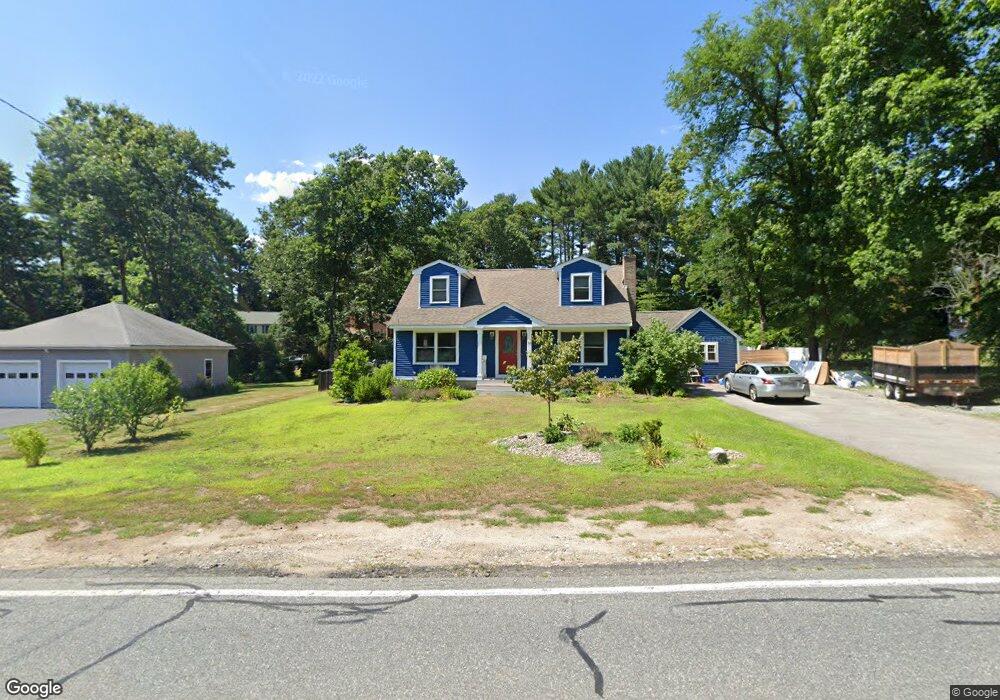
About This Home
This home is located at 439 Brook St, Framingham, MA 01701 and is currently estimated at $636,924, approximately $737 per square foot. 439 Brook St is a home located in Middlesex County with nearby schools including Framingham High School, Summit Montessori School, and MetroWest Jewish Day School.
Ownership History
We collect this data history from publicly available records. To have your information removed, we recommend requesting removal directly through your county’s website.
Purchase Details
Home Values in the Area
Average Home Value in this Area
Purchase History
We collect this data history from publicly available records. To have your information removed, we recommend requesting removal directly through your county’s website.
| Date | Buyer | Sale Price | Title Company |
|---|---|---|---|
| $200,000 | -- |
Mortgage History
We collect this data history from publicly available records. To have your information removed, we recommend requesting removal directly through your county’s website.
| Date | Status | Borrower | Loan Amount |
|---|---|---|---|
| Open | $54,000 | ||
| Open | $235,000 |
Tax History
We collect this data history from publicly available records. To have your information removed, we recommend requesting removal directly through your county’s website.
| Year | Tax Paid | Tax Assessment Tax Assessment Total Assessment is a certain percentage of the fair market value that is determined by local assessors to be the total taxable value of land and additions on the property. | Land | Improvement |
|---|---|---|---|---|
| 2025 | $6,899 | $577,800 | $284,900 | $292,900 |
| 2024 | $6,084 | $488,300 | $254,300 | $234,000 |
| 2023 | $5,760 | $440,000 | $227,000 | $213,000 |
| 2022 | $5,475 | $398,500 | $206,000 | $192,500 |
| 2021 | $5,318 | $378,500 | $198,000 | $180,500 |
| 2020 | $4,557 | $304,200 | $179,900 | $124,300 |
| 2019 | $4,479 | $291,200 | $179,900 | $111,300 |
| 2018 | $4,450 | $272,700 | $173,200 | $99,500 |
| 2017 | $4,383 | $262,300 | $168,100 | $94,200 |
| 2016 | $4,291 | $246,900 | $168,100 | $78,800 |
| 2015 | $4,334 | $243,200 | $168,200 | $75,000 |
Map
- 51 Higgins Rd
- 5 Perry Henderson Dr
- 96 Higgins Rd
- 67 Leigh St
- 104 Higgins Rd
- 477 Edgell Rd
- 94 Fenwick St
- 2 Whiting Rd
- 8 Fairbrook Rd
- 11 Bacon Rd
- 331 Prospect St
- 258 Edgell Rd
- 61 Indian Head Rd
- 15 Crestwood Dr
- 15 Lilian Rd
- 12 Lilian Rd
- 1711 Windsor Dr Unit 1711
- 11 Geraldine Rd
- 769 Potter Rd
- 2003 Windsor Dr Unit 2003
Ask me questions while you tour the home.