Estimated Value: $257,000 - $316,000
3
Beds
2
Baths
1,266
Sq Ft
$227/Sq Ft
Est. Value
About This Home
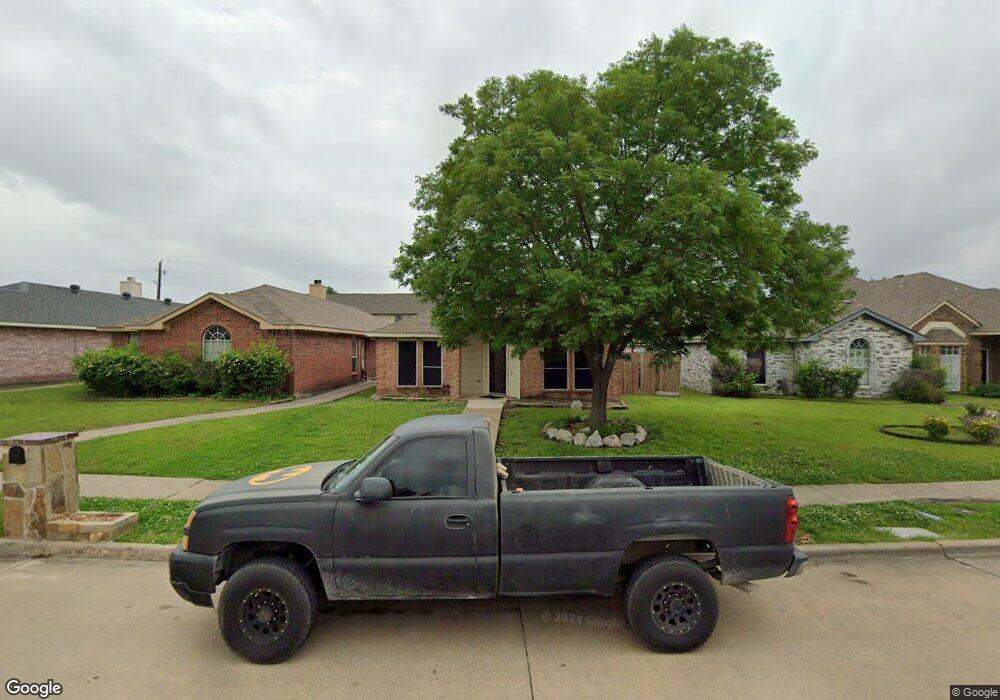
This home is located at 439 Fleming St, Wylie, TX 75098 and is currently estimated at $287,003, approximately $226 per square foot. 439 Fleming St is a home located in Collin County with nearby schools including T.F. Birmingham Elementary School, Frank Mcmillan Junior High School, and Davis Intermediate School.
Ownership History
Date
Name
Owned For
Owner Type
Purchase Details
Closed on
Jun 17, 2024
Sold by
Frey-Mahler Amelia
Bought by
Amelia Frey-Mahler Trust and Frey-Mahler
Current Estimated Value
Purchase Details
Closed on
Oct 16, 2002
Sold by
Johnson Richard Michael and Johnson Amanda
Bought by
Congdon Seth R and Congdon Shannon
Home Financials for this Owner
Home Financials are based on the most recent Mortgage that was taken out on this home.
Original Mortgage
$102,000
Interest Rate
6.01%
Mortgage Type
VA
Purchase Details
Closed on
May 12, 2000
Sold by
Phillips William and Phillips Angela
Bought by
Johnson Richard Michael
Home Financials for this Owner
Home Financials are based on the most recent Mortgage that was taken out on this home.
Original Mortgage
$78,806
Interest Rate
8.19%
Purchase Details
Closed on
Jul 31, 1995
Sold by
Matthews Richard C and Matthews Bernadette M
Bought by
Phillips William and Phillips Angela
Home Financials for this Owner
Home Financials are based on the most recent Mortgage that was taken out on this home.
Original Mortgage
$65,951
Interest Rate
7.51%
Mortgage Type
FHA
Create a Home Valuation Report for This Property
The Home Valuation Report is an in-depth analysis detailing your home's value as well as a comparison with similar homes in the area
Home Values in the Area
Average Home Value in this Area
Purchase History
| Date | Buyer | Sale Price | Title Company |
|---|---|---|---|
| Amelia Frey-Mahler Trust | -- | None Listed On Document | |
| Congdon Seth R | -- | -- | |
| Johnson Richard Michael | -- | -- | |
| Phillips William | -- | -- |
Source: Public Records
Mortgage History
| Date | Status | Borrower | Loan Amount |
|---|---|---|---|
| Previous Owner | Congdon Seth R | $102,000 | |
| Previous Owner | Johnson Richard Michael | $78,806 | |
| Previous Owner | Phillips William | $65,951 |
Source: Public Records
Tax History
| Year | Tax Paid | Tax Assessment Tax Assessment Total Assessment is a certain percentage of the fair market value that is determined by local assessors to be the total taxable value of land and additions on the property. | Land | Improvement |
|---|---|---|---|---|
| 2025 | $5,019 | $257,489 | $90,000 | $167,489 |
| 2024 | $5,060 | $256,194 | $68,850 | $187,344 |
| 2023 | $5,060 | $273,477 | $68,850 | $204,627 |
| 2022 | $5,629 | $256,574 | $71,250 | $185,324 |
| 2021 | $4,791 | $203,640 | $57,000 | $146,640 |
| 2020 | $4,783 | $192,612 | $40,375 | $152,237 |
| 2019 | $5,046 | $192,005 | $40,375 | $151,630 |
| 2018 | $4,939 | $183,396 | $40,375 | $143,021 |
| 2017 | $4,412 | $163,821 | $40,375 | $123,446 |
| 2016 | $3,781 | $136,094 | $28,263 | $107,831 |
| 2015 | $3,066 | $121,437 | $24,225 | $97,212 |
Source: Public Records
Map
Nearby Homes
- 426 Elliot St
- 621 Fleming St
- 500 W Oak St
- 107 N Winding Oaks Dr
- 405 W Oak St
- 332 Celia Cir
- 614 Burchshire Ln
- 300 S Cottonbelt Ave Unit 3A
- 609 W Oak St
- 115 Pullman Place
- 804 Eaglescliffe Landing
- 804 Memorial Dr
- 307 W Brown St
- 820 Eaglescliffe Landing
- 805 Easter Dr
- 1008 Mardi Gras Ln
- 304 N Jackson Ave
- 205 Stone Cir
- 400 Vicki Ln
- 409 Kathy Ln
- 437 Fleming St
- 441 Fleming St
- 435 Fleming St
- 443 Fleming St
- 433 Fleming St
- 445 Fleming St
- 431 Fleming St
- 501 Fleming St
- 432 Fleming St
- 430 Fleming St
- 429 Fleming St
- 434 Fleming St
- 428 Fleming St
- 503 Fleming St
- 426 Fleming St
- 427 Fleming St
- 424 Fleming St
- 425 Fleming St
- 119 S Winding Oaks Dr
- 423 Fleming St
Your Personal Tour Guide
Ask me questions while you tour the home.