439 Maple St Winchendon, MA 01475
Estimated Value: $316,000 - $354,000
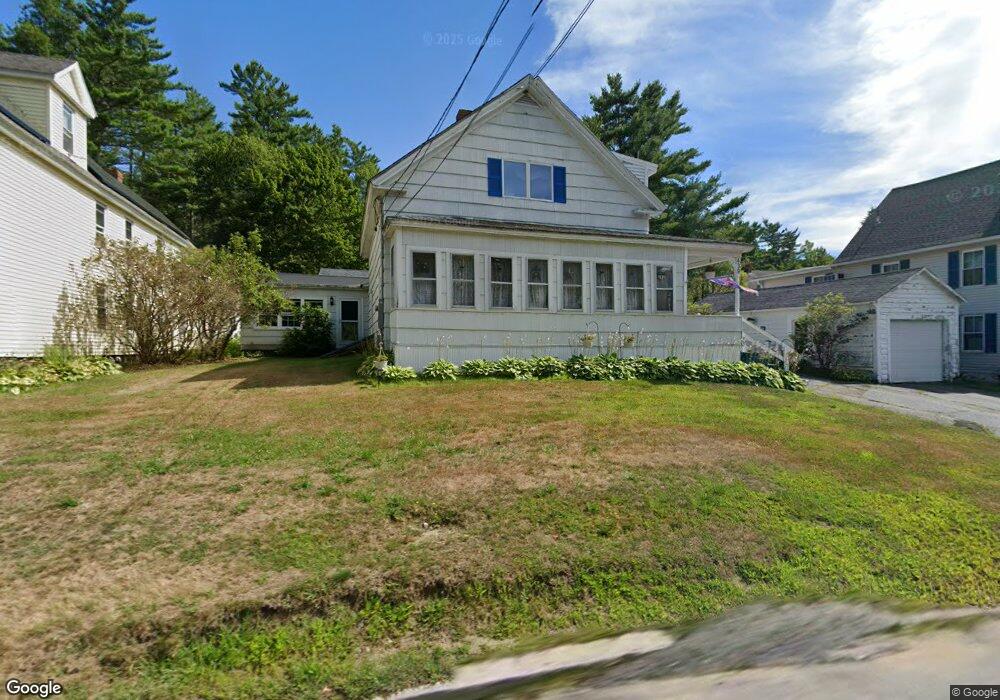
About This Home
This home is located at 439 Maple St, Winchendon, MA 01475 and is currently estimated at $335,915, approximately $187 per square foot. 439 Maple St is a home located in Worcester County with nearby schools including Memorial, Toy Town Elementary School, and The Winchendon School.
Ownership History
We collect this data history from publicly available records. To have your information removed, we recommend requesting removal directly through your county’s website.
Purchase Details
Home Financials for this Owner
Home Financials are based on the most recent Mortgage that was taken out on this home.Home Values in the Area
Average Home Value in this Area
Purchase History
We collect this data history from publicly available records. To have your information removed, we recommend requesting removal directly through your county’s website.
| Date | Buyer | Sale Price | Title Company |
|---|---|---|---|
| $75,000 | -- | ||
| $75,000 | -- |
Mortgage History
We collect this data history from publicly available records. To have your information removed, we recommend requesting removal directly through your county’s website.
| Date | Status | Borrower | Loan Amount |
|---|---|---|---|
| Open | $50,000 | ||
| Closed | $50,000 | ||
| Closed | $10,000 |
Tax History
We collect this data history from publicly available records. To have your information removed, we recommend requesting removal directly through your county’s website.
| Year | Tax Paid | Tax Assessment Tax Assessment Total Assessment is a certain percentage of the fair market value that is determined by local assessors to be the total taxable value of land and additions on the property. | Land | Improvement |
|---|---|---|---|---|
| 2025 | $3,002 | $255,500 | $34,400 | $221,100 |
| 2024 | $2,923 | $233,100 | $33,000 | $200,100 |
| 2023 | $3,047 | $227,400 | $32,200 | $195,200 |
| 2022 | $2,348 | $155,400 | $40,600 | $114,800 |
| 2021 | $2,367 | $150,600 | $37,000 | $113,600 |
| 2020 | $2,409 | $148,000 | $34,400 | $113,600 |
| 2019 | $2,314 | $138,500 | $31,900 | $106,600 |
| 2018 | $2,181 | $125,700 | $29,700 | $96,000 |
| 2017 | $2,264 | $126,000 | $33,500 | $92,500 |
| 2016 | $2,147 | $123,200 | $31,900 | $91,300 |
| 2015 | $2,060 | $123,200 | $31,900 | $91,300 |
| 2014 | $1,960 | $122,800 | $33,800 | $89,000 |
Map
- 170 Glenallen St
- 20 Harvard St
- 226 Lakeview Dr
- 33 East St
- 34 Emerald St
- 18 Marina Way
- 118 Spring St
- 6 Spruce St
- 25 Northern Heights Dr
- 22 Prospect St
- 10-12 School Square
- 38 West St
- 98 Goldmine Rd
- 101 Hubbard Hill Rd
- 6 Country Meadows Dr
- 110 W Shore Dr
- 33 Woods Crossing Rd
- 660 Forristall Rd
- 118 Lachance Dr
- 33 Andel Ave
- 441 Maple St
- 437 Maple St
- 16 Maple Place
- 5 Maple Pl B
- 5 Maple Place
- 5 Maple Place
- 5 Maple Place Unit B
- 447 Maple St
- 6 Maple Place
- 6 Maple Place
- 6 Maple Place Unit A
- 16B Maple Place
- 446 Maple St Unit D
- 446 Maple St Unit C
- 446 Maple St Unit A
- 446 Maple St
- 446 Maple St
- 449 Maple St
- 7 Maple Place
- 7 Maple Place
Ask me questions while you tour the home.