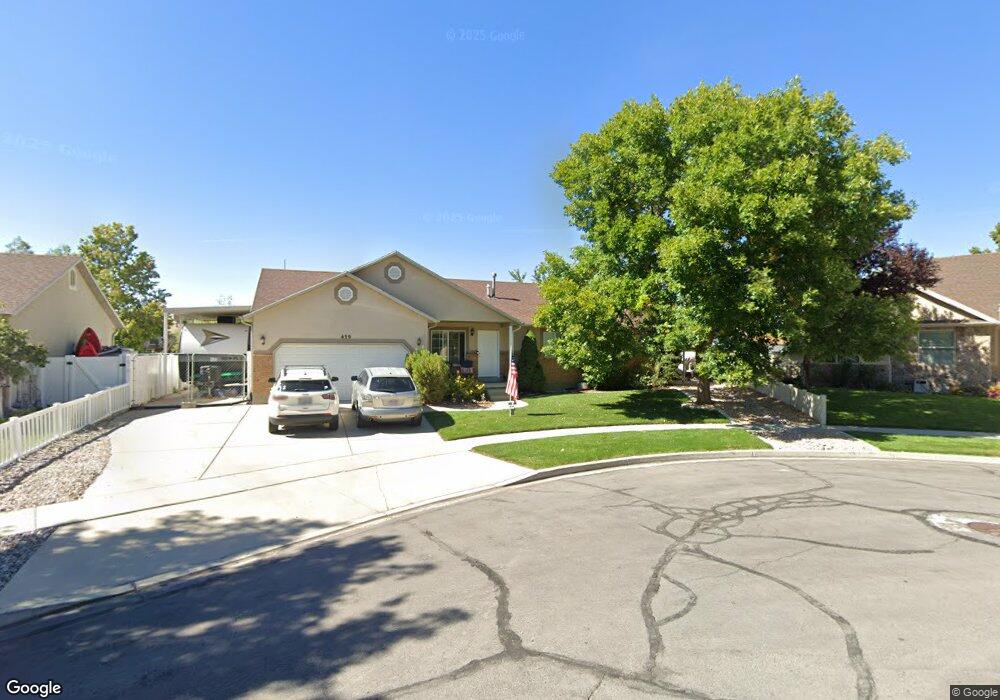
439 N 1040 E Orem, UT 84097
Orchard South NeighborhoodEstimated Value: $558,000 - $721,000
3
Beds
2
Baths
2,980
Sq Ft
$209/Sq Ft
Est. Value
About This Home
This home is located at 439 N 1040 E, Orem, UT 84097 and is currently estimated at $622,468, approximately $208 per square foot. 439 N 1040 E is a home located in Utah County with nearby schools including Cascade Elementary School, Canyon View Junior High School, and Orem High School.
Ownership History
Date
Name
Owned For
Owner Type
Purchase Details
Closed on
Mar 27, 2023
Sold by
Ross Benjamin H and Ross Patsy A
Bought by
Benjamin And Patsy Ross Living Trust and Ross
Current Estimated Value
Purchase Details
Closed on
Jun 20, 2001
Sold by
Panda Homes Llc
Bought by
Ross Benjamin H and Ross Patsy A
Home Financials for this Owner
Home Financials are based on the most recent Mortgage that was taken out on this home.
Original Mortgage
$126,750
Interest Rate
7.15%
Create a Home Valuation Report for This Property
The Home Valuation Report is an in-depth analysis detailing your home's value as well as a comparison with similar homes in the area
Home Values in the Area
Average Home Value in this Area
Purchase History
| Date | Buyer | Sale Price | Title Company |
|---|---|---|---|
| Benjamin And Patsy Ross Living Trust | -- | None Listed On Document | |
| Ross Benjamin H | -- | -- |
Source: Public Records
Mortgage History
| Date | Status | Borrower | Loan Amount |
|---|---|---|---|
| Previous Owner | Ross Benjamin H | $126,750 |
Source: Public Records
Tax History
| Year | Tax Paid | Tax Assessment Tax Assessment Total Assessment is a certain percentage of the fair market value that is determined by local assessors to be the total taxable value of land and additions on the property. | Land | Improvement |
|---|---|---|---|---|
| 2025 | $2,473 | $311,025 | -- | -- |
| 2024 | $2,473 | $302,390 | $0 | $0 |
| 2023 | $2,337 | $307,175 | $0 | $0 |
| 2022 | $2,361 | $300,630 | $0 | $0 |
| 2021 | $2,020 | $389,500 | $153,500 | $236,000 |
| 2020 | $1,869 | $354,200 | $122,800 | $231,400 |
| 2019 | $1,742 | $343,400 | $112,000 | $231,400 |
| 2018 | $1,644 | $309,600 | $108,400 | $201,200 |
| 2017 | $1,603 | $161,700 | $0 | $0 |
| 2016 | $1,501 | $139,645 | $0 | $0 |
| 2015 | $1,565 | $137,665 | $0 | $0 |
| 2014 | $1,409 | $123,365 | $0 | $0 |
Source: Public Records
Map
Nearby Homes
Your Personal Tour Guide
Ask me questions while you tour the home.