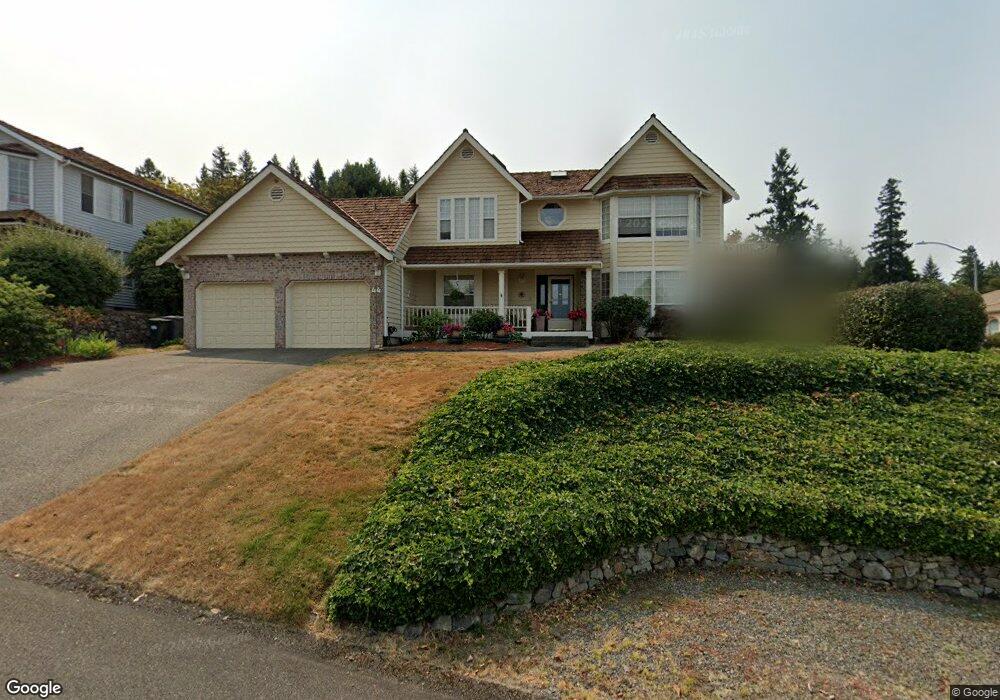
44 Chapman Loop Steilacoom, WA 98388
Estimated Value: $846,000 - $1,437,000
About This Home
This home is located at 44 Chapman Loop, Steilacoom, WA 98388 and is currently estimated at $1,063,671, approximately $387 per square foot. 44 Chapman Loop is a home located in Pierce County with nearby schools including Saltars Point Elementary School, Cherrydale Elementary School, and Pioneer Middle School.
Ownership History
We collect this data history from publicly available records. To have your information removed, we recommend requesting removal directly through your county’s website.
Purchase Details
Purchase Details
Home Financials for this Owner
Home Financials are based on the most recent Mortgage that was taken out on this home.Home Values in the Area
Average Home Value in this Area
Purchase History
We collect this data history from publicly available records. To have your information removed, we recommend requesting removal directly through your county’s website.
| Date | Buyer | Sale Price | Title Company |
|---|---|---|---|
| -- | None Listed On Document | ||
| $362,000 | -- |
Mortgage History
We collect this data history from publicly available records. To have your information removed, we recommend requesting removal directly through your county’s website.
| Date | Status | Borrower | Loan Amount |
|---|---|---|---|
| Previous Owner | $252,700 |
Tax History
We collect this data history from publicly available records. To have your information removed, we recommend requesting removal directly through your county’s website.
| Year | Tax Paid | Tax Assessment Tax Assessment Total Assessment is a certain percentage of the fair market value that is determined by local assessors to be the total taxable value of land and additions on the property. | Land | Improvement |
|---|---|---|---|---|
| 2025 | $7,702 | $937,000 | $445,900 | $491,100 |
| 2024 | $7,702 | $918,700 | $437,000 | $481,700 |
| 2023 | $7,702 | $894,500 | $461,300 | $433,200 |
| 2022 | $7,460 | $900,900 | $476,200 | $424,700 |
| 2021 | $7,650 | $710,200 | $383,900 | $326,300 |
| 2019 | $7,029 | $659,900 | $339,800 | $320,100 |
| 2018 | $7,376 | $634,700 | $295,300 | $339,400 |
| 2017 | $6,623 | $579,900 | $259,200 | $320,700 |
| 2016 | $6,132 | $546,000 | $240,400 | $305,600 |
| 2014 | $6,154 | $477,600 | $199,200 | $278,400 |
| 2013 | $6,154 | $459,600 | $183,300 | $276,300 |
Map
- 126 Cormorant Dr
- 209 Casey Ct
- 306 Keach Loop
- 601 Chris David Dr
- 1069 5th St
- 710 Chris David Dr
- 709 Chris David Dr
- 814 5th St
- 47 Wallace St
- 1307 Walnut Ln
- 516 1st St
- 811 Union Ave
- 503 5th St
- 707 Gove St
- 307 4th St
- 0 Starling St
- 702 Martin St
- 0 Morris Blvd Unit NWM2268127
- 1225 Adams St
- 10318 Morris Blvd
- 0 L5 W Shore Ct
- 46 W Shore Ct
- 6 W Shore Ct
- 42 Chapman Loop
- 50 West Shore Ct
- 46 Chapman Loop
- 47 Chapman Loop
- 27 W Shore Ct
- 27 West Shore Ct
- 40 Chapman Loop
- 46 West Shore Ct
- 45 Chapman Loop
- 49 Chapman Loop
- 48 Chapman Loop
- 42 W Shore Ct
- 42 West Shore Ct
- 25 West Shore Ct
- 25 W Shore Ct
- 85 Chapman Loop
- 50 Chapman Loop
Ask me questions while you tour the home.