44 S Walnut St Quincy, MA 02169
Quincy Point NeighborhoodEstimated Value: $485,000 - $546,931
About This Home
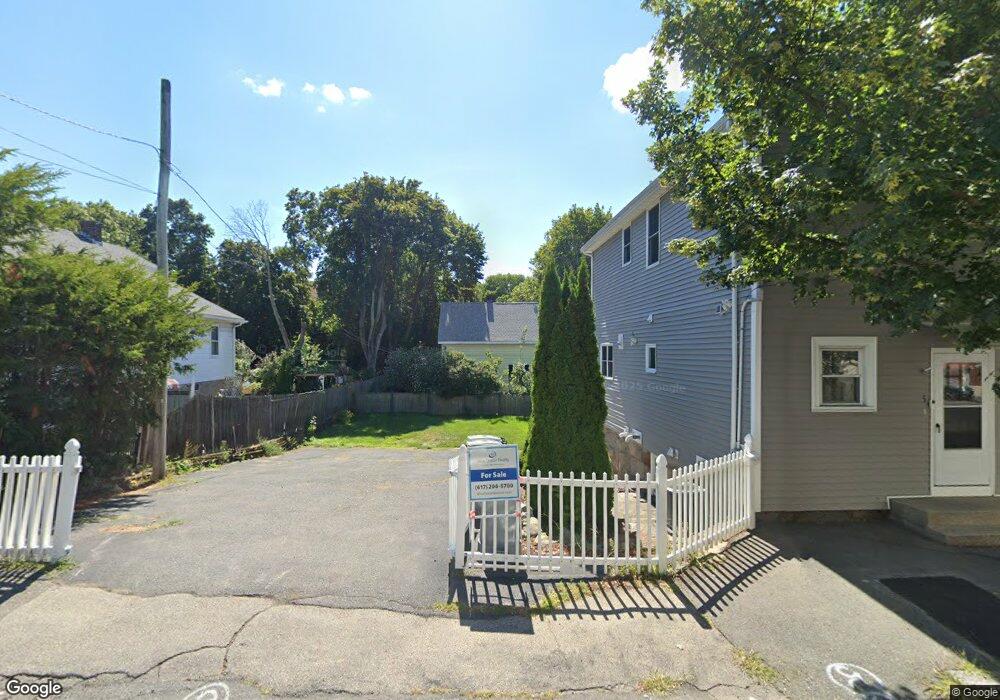
This home is located at 44 S Walnut St, Quincy, MA 02169 and is currently estimated at $519,733, approximately $433 per square foot. 44 S Walnut St is a home located in Norfolk County with nearby schools including Point Webster Middle School, Clifford H. Marshall Elementary School, and Quincy High School.
Ownership History
We collect this data history from publicly available records. To have your information removed, we recommend requesting removal directly through your county’s website.
Purchase Details
Home Financials for this Owner
Home Financials are based on the most recent Mortgage that was taken out on this home.Purchase Details
Home Values in the Area
Average Home Value in this Area
Purchase History
We collect this data history from publicly available records. To have your information removed, we recommend requesting removal directly through your county’s website.
| Date | Buyer | Sale Price | Title Company |
|---|---|---|---|
| $275,000 | None Available | ||
| -- | -- |
Mortgage History
We collect this data history from publicly available records. To have your information removed, we recommend requesting removal directly through your county’s website.
| Date | Status | Borrower | Loan Amount |
|---|---|---|---|
| Closed | $206,250 |
Tax History
We collect this data history from publicly available records. To have your information removed, we recommend requesting removal directly through your county’s website.
| Year | Tax Paid | Tax Assessment Tax Assessment Total Assessment is a certain percentage of the fair market value that is determined by local assessors to be the total taxable value of land and additions on the property. | Land | Improvement |
|---|---|---|---|---|
| 2025 | $5,375 | $466,200 | $273,800 | $192,400 |
| 2024 | $5,026 | $446,000 | $260,800 | $185,200 |
| 2023 | $4,517 | $405,800 | $237,100 | $168,700 |
| 2022 | $4,506 | $376,100 | $215,500 | $160,600 |
| 2021 | $4,344 | $357,800 | $215,500 | $142,300 |
| 2020 | $4,139 | $333,000 | $203,300 | $129,700 |
| 2019 | $3,973 | $316,600 | $188,300 | $128,300 |
| 2018 | $3,806 | $285,300 | $171,100 | $114,200 |
| 2017 | $3,807 | $268,700 | $163,000 | $105,700 |
| 2016 | $3,560 | $247,900 | $148,100 | $99,800 |
| 2015 | $3,371 | $230,900 | $139,700 | $91,200 |
| 2014 | $3,306 | $222,500 | $139,700 | $82,800 |
Map
- 113 Elm St Unit D
- 53 S Walnut St Unit 3
- 123 Elm St Unit C-2
- 62 South St Unit 1A
- 62 South St Unit 15
- 44 Elm St
- 72 Dysart St
- 96 South St
- 27 Clarendon St
- 11 Alden St
- 106 Washington St Unit 23
- 2 Cliveden St Unit 601E
- 2 Cliveden St Unit 403
- 66 Mcgrath Hwy Unit 509
- 66 Mcgrath Hwy Unit 507
- 66 Mcgrath Hwy Unit 309
- 66 Mcgrath Hwy Unit 510
- 66 Mcgrath Hwy Unit 506
- 45 Sumner St
- 59 Spear St Unit 3
- 9 Union St
- 5 Union St
- 13 Union St
- 11 Union St
- 38 S Walnut St
- 42 S Walnut St Unit 1
- 42 S Walnut St
- 16 Union St
- 17 Union St
- 17 Union St Unit 3
- 17 Union St Unit 2
- 40 S Walnut St
- 40 S Walnut St Unit 1
- 14 Union St
- 14 Union St Unit 2
- 41 S Walnut St
- 41 S Walnut St Unit 2
- 41 S Walnut St
- 41 S Walnut St Unit 1
- 41 S Walnut St Unit 3
Ask me questions while you tour the home.