440 Walnut St West Bridgewater, MA 02379
Estimated Value: $546,000 - $586,000
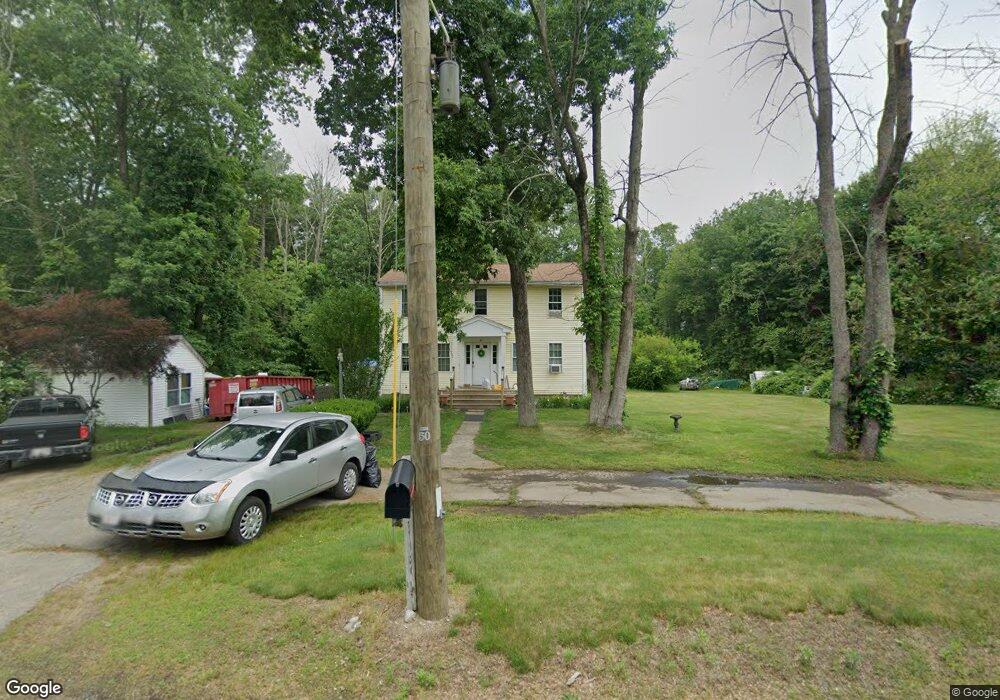
About This Home
This home is located at 440 Walnut St, West Bridgewater, MA 02379 and is currently estimated at $562,754, approximately $338 per square foot. 440 Walnut St is a home located in Plymouth County with nearby schools including Spring Street Elementary School, Rose L. MacDonald Elementary School, and Howard Elementary School.
Ownership History
We collect this data history from publicly available records. To have your information removed, we recommend requesting removal directly through your county’s website.
Purchase Details
Home Financials for this Owner
Home Financials are based on the most recent Mortgage that was taken out on this home.Home Values in the Area
Average Home Value in this Area
Purchase History
We collect this data history from publicly available records. To have your information removed, we recommend requesting removal directly through your county’s website.
| Date | Buyer | Sale Price | Title Company |
|---|---|---|---|
| $308,000 | -- |
Mortgage History
We collect this data history from publicly available records. To have your information removed, we recommend requesting removal directly through your county’s website.
| Date | Status | Borrower | Loan Amount |
|---|---|---|---|
| Open | $244,000 | ||
| Closed | $220,000 |
Tax History
We collect this data history from publicly available records. To have your information removed, we recommend requesting removal directly through your county’s website.
| Year | Tax Paid | Tax Assessment Tax Assessment Total Assessment is a certain percentage of the fair market value that is determined by local assessors to be the total taxable value of land and additions on the property. | Land | Improvement |
|---|---|---|---|---|
| 2025 | $5,732 | $419,300 | $234,600 | $184,700 |
| 2024 | $5,562 | $392,500 | $212,900 | $179,600 |
| 2023 | $5,169 | $336,300 | $184,300 | $152,000 |
| 2022 | $5,100 | $314,400 | $173,400 | $141,000 |
| 2021 | $5,028 | $300,900 | $173,400 | $127,500 |
| 2020 | $5,035 | $307,600 | $173,400 | $134,200 |
| 2019 | $4,995 | $302,200 | $173,400 | $128,800 |
| 2018 | $5,182 | $285,600 | $164,700 | $120,900 |
| 2017 | $4,723 | $266,400 | $149,400 | $117,000 |
| 2016 | $4,606 | $255,900 | $138,900 | $117,000 |
| 2015 | $4,440 | $249,300 | $138,900 | $110,400 |
| 2014 | $4,111 | $249,300 | $138,900 | $110,400 |
Map
- 332 Linwood St
- 115 Talbot St
- 3 Marisa Dr
- 102 Turnpike St
- 14 Highfield Dr
- 129 Turnpike St
- 35 Chestnut Dr
- 15 W Meadow Dr
- 2 Adam St Unit 2
- 4 County Ln
- 43 Progressive Ave
- 14 Nancy Rd Unit 6
- 9 Adam St Unit 11
- 37 Roberta Ave
- 595 Washington St
- 120 Hatchfield Dr
- 14 Sharron Dr Unit 14
- 44 Dawes Rd
- 70 Westfield Dr
- 45 Wyoming Ave
Ask me questions while you tour the home.