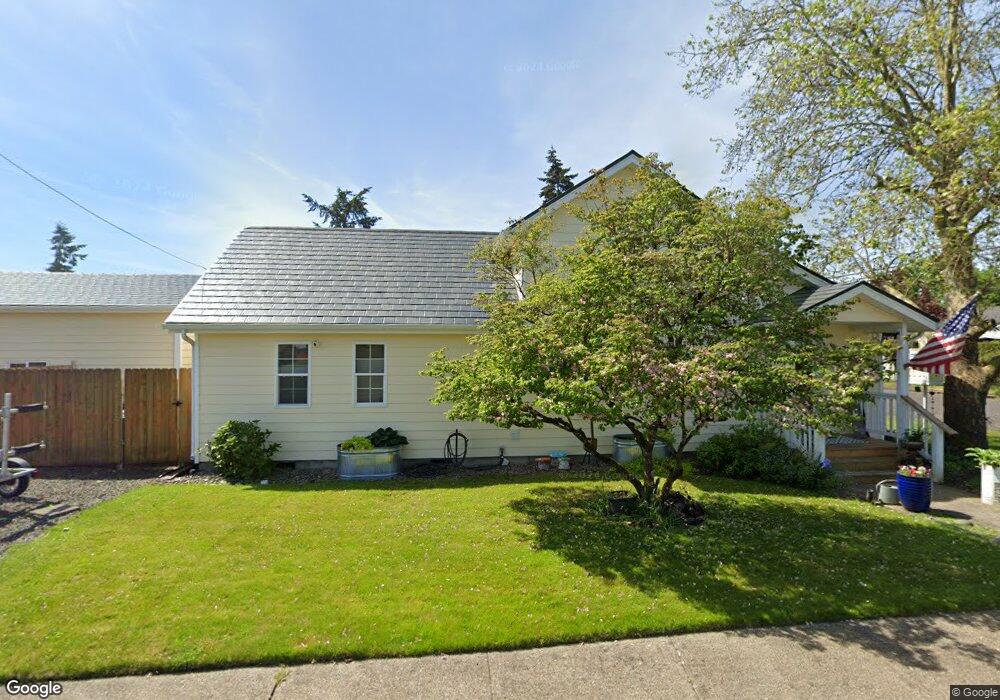
441 E 3rd Ave Junction City, OR 97448
Estimated Value: $342,000 - $497,000
3
Beds
2
Baths
1,218
Sq Ft
$315/Sq Ft
Est. Value
About This Home
This home is located at 441 E 3rd Ave, Junction City, OR 97448 and is currently estimated at $384,230, approximately $315 per square foot. 441 E 3rd Ave is a home located in Lane County with nearby schools including Junction City High School.
Ownership History
Date
Name
Owned For
Owner Type
Purchase Details
Closed on
Sep 26, 2017
Sold by
Whaley Noland P
Bought by
Whaley Noland P and Whaley Glenda
Current Estimated Value
Purchase Details
Closed on
Jul 20, 2016
Sold by
Lutz Gloria J
Bought by
Whaley Noland P
Home Financials for this Owner
Home Financials are based on the most recent Mortgage that was taken out on this home.
Original Mortgage
$203,000
Outstanding Balance
$161,723
Interest Rate
3.6%
Mortgage Type
VA
Estimated Equity
$222,507
Purchase Details
Closed on
May 4, 2016
Sold by
Lutz Gloria J and Bloom Gloria J
Bought by
Lutz Gloria J and The Gloria J Lutz Trust
Create a Home Valuation Report for This Property
The Home Valuation Report is an in-depth analysis detailing your home's value as well as a comparison with similar homes in the area
Home Values in the Area
Average Home Value in this Area
Purchase History
| Date | Buyer | Sale Price | Title Company |
|---|---|---|---|
| Whaley Noland P | -- | Cascade Title Company | |
| Whaley Noland P | $203,500 | Cascade Title Company | |
| Lutz Gloria J | -- | None Available |
Source: Public Records
Mortgage History
| Date | Status | Borrower | Loan Amount |
|---|---|---|---|
| Open | Whaley Noland P | $203,000 |
Source: Public Records
Tax History
| Year | Tax Paid | Tax Assessment Tax Assessment Total Assessment is a certain percentage of the fair market value that is determined by local assessors to be the total taxable value of land and additions on the property. | Land | Improvement |
|---|---|---|---|---|
| 2025 | $2,563 | $183,298 | -- | -- |
| 2024 | $2,473 | $177,960 | -- | -- |
| 2023 | $2,473 | $172,777 | $0 | $0 |
| 2022 | $2,307 | $167,745 | $0 | $0 |
| 2021 | $2,261 | $162,860 | $0 | $0 |
| 2020 | $2,189 | $158,117 | $0 | $0 |
| 2019 | $2,112 | $153,512 | $0 | $0 |
| 2018 | $2,051 | $144,700 | $0 | $0 |
| 2017 | $1,979 | $144,700 | $0 | $0 |
| 2016 | $2,324 | $140,485 | $0 | $0 |
| 2015 | $2,054 | $136,393 | $0 | $0 |
| 2014 | $2,063 | $132,420 | $0 | $0 |
Source: Public Records
Map
Nearby Homes
- 371 E 2nd Ave
- 301 Deal St
- 145 River Rd Unit 13
- 351 Front St
- 1021 Deal St
- 346 E 10th Place
- 648 Juniper St
- 617 Juniper St
- 645 Juniper St
- 0 Holly St
- 445 SW Juniper St
- 94034 Viking St
- 861 W 10th Ave
- 1085 W 1st Ave Unit J
- 1085 W 1st Ave Unit L
- 1085 W 1st Ave Unit K
- 1085 W 1st Ave Unit R
- 1085 W 1st Ave Unit E
- 1355 Juniper St
- 1090 Nyssa St
Your Personal Tour Guide
Ask me questions while you tour the home.