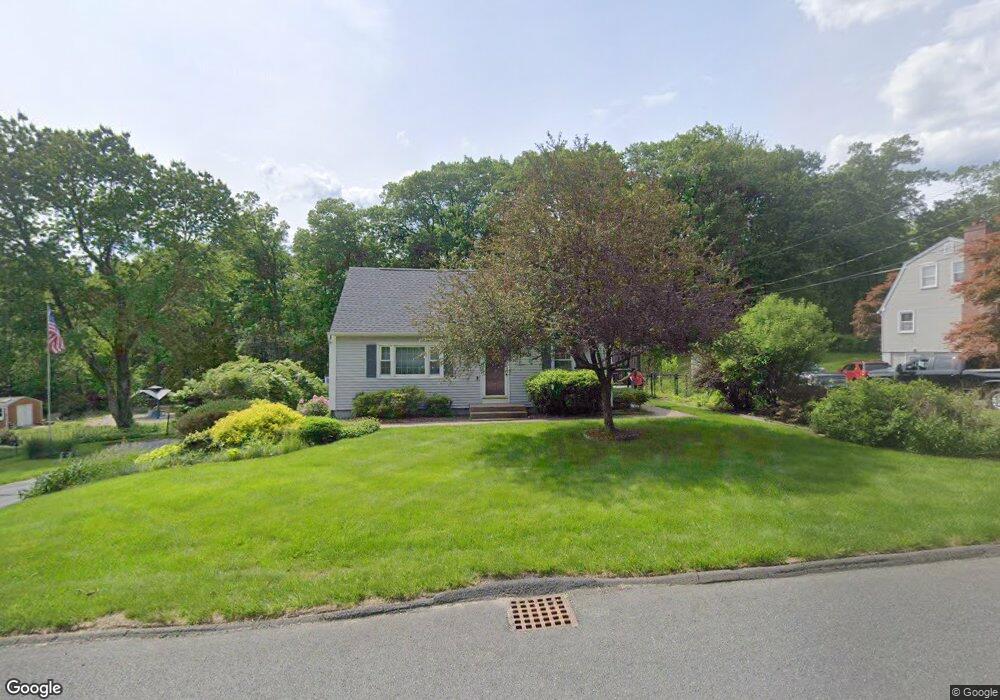
441 West Rd Westfield, MA 01085
Estimated Value: $348,297 - $468,000
2
Beds
2
Baths
1,428
Sq Ft
$278/Sq Ft
Est. Value
About This Home
This home is located at 441 West Rd, Westfield, MA 01085 and is currently estimated at $396,824, approximately $277 per square foot. 441 West Rd is a home located in Hampden County with nearby schools including Westfield High School and White Oak School.
Ownership History
Date
Name
Owned For
Owner Type
Purchase Details
Closed on
Mar 30, 2011
Sold by
Brannan Albert C and Brannan Linda M
Bought by
Lindenmuth Michele A
Current Estimated Value
Home Financials for this Owner
Home Financials are based on the most recent Mortgage that was taken out on this home.
Original Mortgage
$176,000
Outstanding Balance
$120,149
Interest Rate
5.04%
Mortgage Type
Purchase Money Mortgage
Estimated Equity
$276,675
Create a Home Valuation Report for This Property
The Home Valuation Report is an in-depth analysis detailing your home's value as well as a comparison with similar homes in the area
Home Values in the Area
Average Home Value in this Area
Purchase History
| Date | Buyer | Sale Price | Title Company |
|---|---|---|---|
| Lindenmuth Michele A | $220,000 | -- |
Source: Public Records
Mortgage History
| Date | Status | Borrower | Loan Amount |
|---|---|---|---|
| Open | Lindenmuth Michele A | $176,000 |
Source: Public Records
Tax History
| Year | Tax Paid | Tax Assessment Tax Assessment Total Assessment is a certain percentage of the fair market value that is determined by local assessors to be the total taxable value of land and additions on the property. | Land | Improvement |
|---|---|---|---|---|
| 2025 | $4,487 | $295,600 | $118,200 | $177,400 |
| 2024 | $4,473 | $280,100 | $107,500 | $172,600 |
| 2023 | $4,169 | $254,300 | $102,500 | $151,800 |
| 2022 | $4,169 | $225,500 | $91,300 | $134,200 |
| 2021 | $4,035 | $213,700 | $85,900 | $127,800 |
| 2020 | $3,929 | $204,100 | $85,900 | $118,200 |
| 2019 | $3,845 | $195,500 | $82,000 | $113,500 |
| 2018 | $3,785 | $195,500 | $82,000 | $113,500 |
| 2017 | $3,725 | $191,800 | $83,100 | $108,700 |
| 2016 | $3,729 | $191,800 | $83,100 | $108,700 |
| 2015 | $3,584 | $193,300 | $83,100 | $110,200 |
| 2014 | $2,679 | $193,300 | $83,100 | $110,200 |
Source: Public Records
Map
Nearby Homes
- 52 & 53 Bayberry Ln
- 745 West Rd
- 458 Montgomery Rd
- 274 Prospect Street Extension
- 336 Russellville Rd
- 324 Russell Rd Unit 109
- 132 North Rd
- 12 Woodland Rd
- 180 Russell Rd
- 182 Lockhouse Rd
- 9 Montgomery St
- 32 Allen Ave
- Lot 5 Montgomery
- 0 Lockhouse Rd Unit 73496193
- 19 Kellogg St
- 26 Hayre St
- 19 Arch Rd
- 13 Hampden St
- 13 Green Ave
- 88 Woodmont St
Your Personal Tour Guide
Ask me questions while you tour the home.