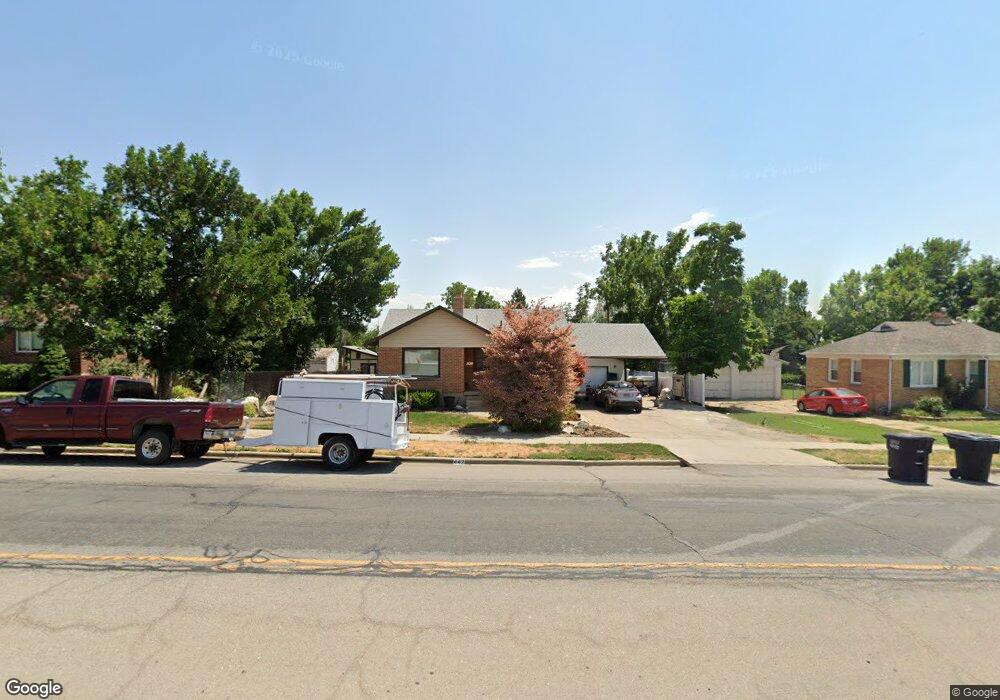
442 E 200 N Kaysville, UT 84037
Estimated Value: $462,000 - $528,000
3
Beds
3
Baths
1,260
Sq Ft
$389/Sq Ft
Est. Value
About This Home
This home is located at 442 E 200 N, Kaysville, UT 84037 and is currently estimated at $490,296, approximately $389 per square foot. 442 E 200 N is a home located in Davis County with nearby schools including Kaysville Elementary School, Kaysville Junior High School, and Davis High School.
Ownership History
Date
Name
Owned For
Owner Type
Purchase Details
Closed on
Dec 18, 2024
Sold by
Petersen Leslie
Bought by
Don And Leslie Petersen Family Revocable Trus and Petersen
Current Estimated Value
Purchase Details
Closed on
Jun 28, 2019
Sold by
Cook Islands Offshore Asset Protection P
Bought by
Petersen Leslie
Purchase Details
Closed on
Nov 8, 2017
Sold by
Hayes June
Bought by
Cook Islands Offshore Asset Protection P
Purchase Details
Closed on
Dec 8, 2000
Sold by
Hayes June W
Bought by
Hayes June W and Hayes James F
Create a Home Valuation Report for This Property
The Home Valuation Report is an in-depth analysis detailing your home's value as well as a comparison with similar homes in the area
Home Values in the Area
Average Home Value in this Area
Purchase History
| Date | Buyer | Sale Price | Title Company |
|---|---|---|---|
| Don And Leslie Petersen Family Revocable Trus | -- | None Listed On Document | |
| Don And Leslie Petersen Family Revocable Trus | -- | None Listed On Document | |
| Petersen Leslie | -- | None Available | |
| Cook Islands Offshore Asset Protection P | -- | -- | |
| Hayes June W | -- | -- |
Source: Public Records
Tax History
| Year | Tax Paid | Tax Assessment Tax Assessment Total Assessment is a certain percentage of the fair market value that is determined by local assessors to be the total taxable value of land and additions on the property. | Land | Improvement |
|---|---|---|---|---|
| 2025 | $2,477 | $257,400 | $138,707 | $118,693 |
| 2024 | $2,363 | $249,150 | $111,345 | $137,805 |
| 2023 | $2,340 | $437,000 | $242,764 | $194,236 |
| 2022 | $2,368 | $248,050 | $130,701 | $117,349 |
| 2021 | $2,197 | $345,000 | $178,053 | $166,947 |
| 2020 | $1,825 | $279,000 | $149,665 | $129,335 |
| 2019 | $1,752 | $263,000 | $172,690 | $90,310 |
| 2018 | $1,603 | $240,000 | $151,703 | $88,297 |
| 2016 | $1,500 | $118,030 | $38,201 | $79,829 |
| 2015 | $1,443 | $107,800 | $38,201 | $69,599 |
| 2014 | $1,614 | $122,775 | $37,992 | $84,783 |
| 2013 | -- | $97,089 | $25,221 | $71,868 |
Source: Public Records
Map
Nearby Homes
- 1236 E 100 S
- 97 E Crestwood Rd
- 285 E 500 N Unit 102
- 481 N 150 E
- 425 E 500 N
- 400 N 30 E
- 42 W Center St
- 270 N 900 E
- 150 E 600 N Unit 5
- 150 E 600 N Unit 18
- 56 Whitaker Cir
- 125 W 525 N
- 1015 Brook Haven Dr
- 281 W 300 N
- 358 S 850 E
- 290 W 100 N
- 285 W Center St
- 637 Cherrywood Rd
- 250 E 950 N
- 420 N Main St Unit 22
Your Personal Tour Guide
Ask me questions while you tour the home.