Estimated Value: $423,392 - $446,000
4
Beds
1
Bath
1,357
Sq Ft
$320/Sq Ft
Est. Value
About This Home
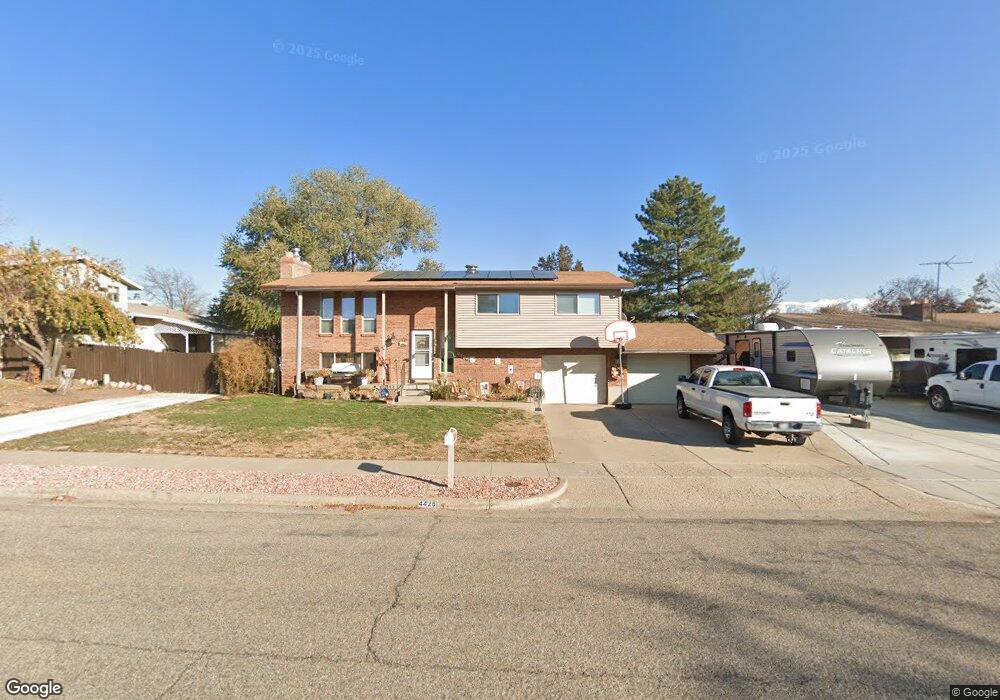
This home is located at 4426 S 2300 W, Roy, UT 84067 and is currently estimated at $434,098, approximately $319 per square foot. 4426 S 2300 W is a home located in Weber County with nearby schools including Valley View School, Sand Ridge Junior High School, and Roy High School.
Ownership History
Date
Name
Owned For
Owner Type
Purchase Details
Closed on
Apr 6, 2018
Sold by
Lansford Leslie K and Lansford Robert W
Bought by
Lansford Robert W and Lansford Leslie K
Current Estimated Value
Home Financials for this Owner
Home Financials are based on the most recent Mortgage that was taken out on this home.
Original Mortgage
$60,000
Interest Rate
4.43%
Mortgage Type
New Conventional
Purchase Details
Closed on
Jul 21, 1998
Sold by
Lansford Leslie Kay and Lansford Robert Wayne
Bought by
Lansford Robert W and Lansford Leslie K
Home Financials for this Owner
Home Financials are based on the most recent Mortgage that was taken out on this home.
Original Mortgage
$79,000
Interest Rate
6.68%
Create a Home Valuation Report for This Property
The Home Valuation Report is an in-depth analysis detailing your home's value as well as a comparison with similar homes in the area
Home Values in the Area
Average Home Value in this Area
Purchase History
We collect this data history from publicly available records. To have your information removed, we recommend requesting removal directly through your county’s website.
| Date | Buyer | Sale Price | Title Company |
|---|---|---|---|
| Lansford Robert W | -- | Cottonwood Title Ins Agcy | |
| Lansford Robert W | -- | Backman Stewart Title |
Source: Public Records
Mortgage History
We collect this data history from publicly available records. To have your information removed, we recommend requesting removal directly through your county’s website.
| Date | Status | Borrower | Loan Amount |
|---|---|---|---|
| Closed | Lansford Robert W | $60,000 | |
| Closed | Lansford Robert W | $79,000 |
Source: Public Records
Tax History
| Year | Tax Paid | Tax Assessment Tax Assessment Total Assessment is a certain percentage of the fair market value that is determined by local assessors to be the total taxable value of land and additions on the property. | Land | Improvement |
|---|---|---|---|---|
| 2025 | $2,685 | $426,867 | $145,328 | $281,539 |
| 2024 | $2,623 | $230,999 | $79,930 | $151,069 |
| 2023 | $2,588 | $228,800 | $80,480 | $148,320 |
| 2022 | $2,490 | $225,500 | $56,280 | $169,220 |
| 2021 | $2,155 | $322,000 | $68,071 | $253,929 |
| 2020 | $1,967 | $269,000 | $68,071 | $200,929 |
| 2019 | $1,883 | $242,000 | $38,977 | $203,023 |
| 2018 | $1,788 | $216,000 | $35,972 | $180,028 |
| 2017 | $1,816 | $207,000 | $35,972 | $171,028 |
| 2016 | $1,631 | $99,128 | $17,477 | $81,651 |
| 2015 | $1,424 | $87,644 | $17,477 | $70,167 |
| 2014 | $1,436 | $87,644 | $17,477 | $70,167 |
Source: Public Records
Map
Nearby Homes
- 2267 W 4350 S
- 4302 S 2325 W
- 2015 W 4225 S
- 4164 S 2400 W
- 4103 S 2175 W
- 283 3800 S 1900 W #283 Unit 283
- 4061 S 2175 W
- 4046 Sandridge Dr Unit 3
- 4046 Sandridge Dr Unit 2
- 4046 Sandridge Dr Unit 4
- 4046 Sandridge Dr Unit 1
- 4047 S 2175 W
- 4539 S 1800 W Unit 127
- 3987 S 2275 W
- 1766 W 4575 S
- 3948 S 2525 W
- 2101 W 3900 S
- 2167 W 4950 S
- 1959 3985 St S Unit 2
- 4598 S Blossom Glen Way
Your Personal Tour Guide
Ask me questions while you tour the home.