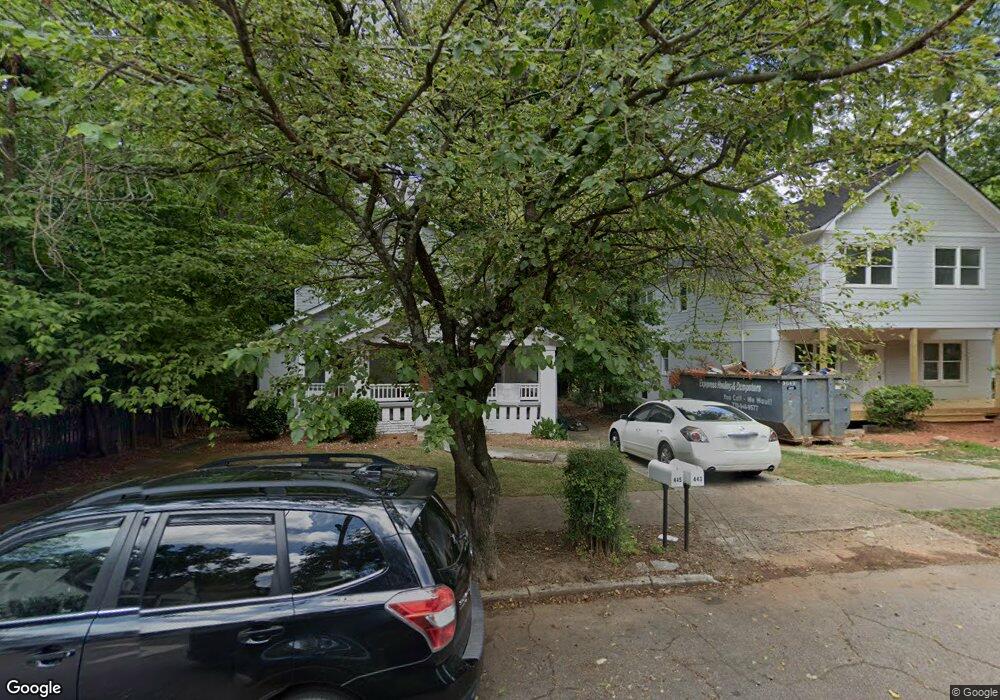
443 3rd Ave Unit A Decatur, GA 30030
Oakhurst NeighborhoodEstimated Value: $741,000 - $923,000
4
Beds
3
Baths
2,024
Sq Ft
$416/Sq Ft
Est. Value
About This Home
This home is located at 443 3rd Ave Unit A, Decatur, GA 30030 and is currently estimated at $841,476, approximately $415 per square foot. 443 3rd Ave Unit A is a home located in DeKalb County with nearby schools including Oakhurst Elementary School, Fifth Avenue Upper Elementary School, and Beacon Hill Middle School.
Ownership History
Date
Name
Owned For
Owner Type
Purchase Details
Closed on
Aug 12, 2016
Sold by
M C
Bought by
Lanier Gamory Tanesha and Gamory Edward Justin
Current Estimated Value
Home Financials for this Owner
Home Financials are based on the most recent Mortgage that was taken out on this home.
Original Mortgage
$314,204
Outstanding Balance
$249,528
Interest Rate
3.42%
Mortgage Type
FHA
Estimated Equity
$591,948
Purchase Details
Closed on
Dec 10, 2014
Sold by
Norman M C
Bought by
Norman M C and Campbell Cheryl Norman
Create a Home Valuation Report for This Property
The Home Valuation Report is an in-depth analysis detailing your home's value as well as a comparison with similar homes in the area
Home Values in the Area
Average Home Value in this Area
Purchase History
| Date | Buyer | Sale Price | Title Company |
|---|---|---|---|
| Lanier Gamory Tanesha | $320,000 | -- | |
| Norman M C | -- | -- |
Source: Public Records
Mortgage History
| Date | Status | Borrower | Loan Amount |
|---|---|---|---|
| Open | Lanier Gamory Tanesha | $314,204 |
Source: Public Records
Tax History
| Year | Tax Paid | Tax Assessment Tax Assessment Total Assessment is a certain percentage of the fair market value that is determined by local assessors to be the total taxable value of land and additions on the property. | Land | Improvement |
|---|---|---|---|---|
| 2025 | $4 | $331,400 | $99,760 | $231,640 |
| 2024 | $5 | $301,520 | $99,760 | $201,760 |
| 2023 | $5 | $271,680 | $77,000 | $194,680 |
| 2022 | $11,143 | $228,360 | $65,160 | $163,200 |
| 2021 | $12,844 | $224,640 | $31,920 | $192,720 |
| 2020 | $7,638 | $151,760 | $31,920 | $119,840 |
| 2019 | $6,859 | $149,960 | $31,920 | $118,040 |
| 2018 | $5,604 | $149,840 | $31,920 | $117,920 |
| 2017 | $6,895 | $129,760 | $31,920 | $97,840 |
| 2016 | $3,584 | $128,200 | $31,920 | $96,280 |
| 2014 | $786 | $81,200 | $31,920 | $49,280 |
Source: Public Records
Map
Nearby Homes
- 143 Maxwell St
- 448 E Lake Dr
- 102 5th Ave
- 508 2nd Ave
- 208 Mellrich Ave NE
- 323 Spring St
- 0 2nd Ave NE Unit 10704406
- 0 2nd Ave NE Unit 7730076
- 236 Mellrich Ave NE
- 2280 1st Ave NE
- 2276 1st Ave NE
- 216 Leyden St
- 248 3rd Ave
- 235 Mead Rd
- 227 Murray Hill Ave NE
- 1736 Oakview Rd
- 108 Park Place
- 108 Park Place Unit 306
- 108 Park Place Unit 110
- 16 1st Ave NE
Your Personal Tour Guide
Ask me questions while you tour the home.