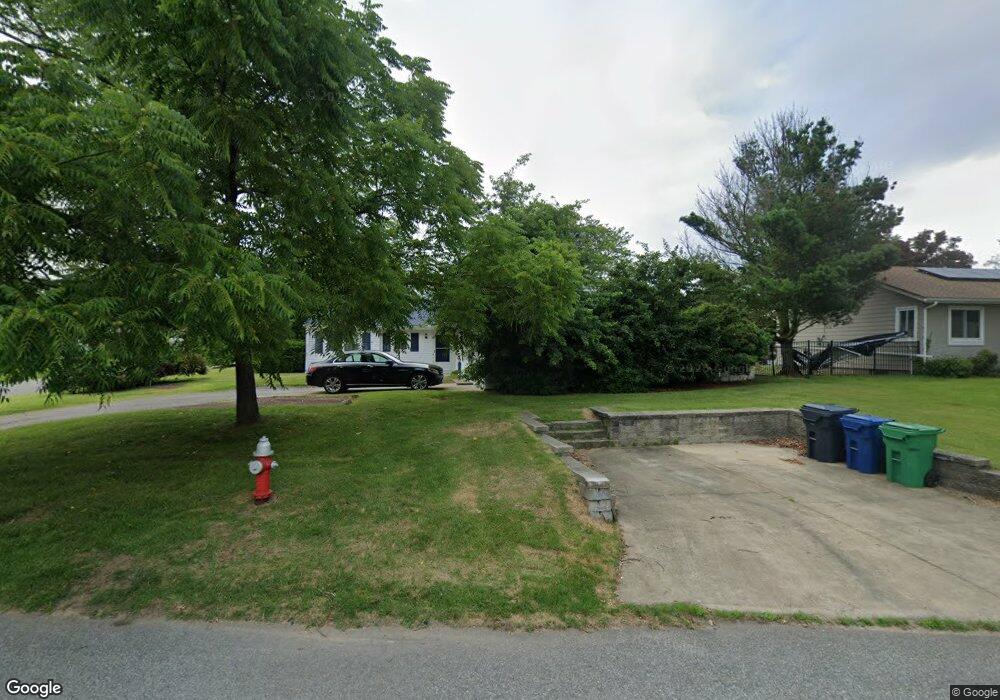
444 Algonquin Dr Warwick, RI 02888
Palace Garden NeighborhoodEstimated Value: $498,000 - $548,000
About This Home
This home is located at 444 Algonquin Dr, Warwick, RI 02888 and is currently estimated at $520,395, approximately $336 per square foot. 444 Algonquin Dr is a home located in Kent County with nearby schools including St. Peter School and Saint Kevin School.
Ownership History
We collect this data history from publicly available records. To have your information removed, we recommend requesting removal directly through your county’s website.
Purchase Details
Purchase Details
Home Financials for this Owner
Home Financials are based on the most recent Mortgage that was taken out on this home.Purchase Details
Purchase Details
Home Values in the Area
Average Home Value in this Area
Purchase History
We collect this data history from publicly available records. To have your information removed, we recommend requesting removal directly through your county’s website.
| Date | Buyer | Sale Price | Title Company |
|---|---|---|---|
| -- | -- | ||
| $305,000 | -- | ||
| $127,000 | -- | ||
| $130,000 | -- |
Mortgage History
We collect this data history from publicly available records. To have your information removed, we recommend requesting removal directly through your county’s website.
| Date | Status | Borrower | Loan Amount |
|---|---|---|---|
| Previous Owner | $45,750 | ||
| Previous Owner | $42,900 | ||
| Previous Owner | $218,820 | ||
| Previous Owner | $55,000 | ||
| Previous Owner | $44,500 | ||
| Previous Owner | $108,400 |
Tax History
We collect this data history from publicly available records. To have your information removed, we recommend requesting removal directly through your county’s website.
| Year | Tax Paid | Tax Assessment Tax Assessment Total Assessment is a certain percentage of the fair market value that is determined by local assessors to be the total taxable value of land and additions on the property. | Land | Improvement |
|---|---|---|---|---|
| 2025 | $5,240 | $412,600 | $153,000 | $259,600 |
| 2024 | $5,115 | $353,500 | $133,000 | $220,500 |
| 2023 | $5,016 | $353,500 | $133,000 | $220,500 |
| 2022 | $4,920 | $262,700 | $95,600 | $167,100 |
| 2021 | $4,920 | $262,700 | $95,600 | $167,100 |
| 2020 | $4,920 | $262,700 | $95,600 | $167,100 |
| 2019 | $4,920 | $262,700 | $95,600 | $167,100 |
| 2018 | $4,566 | $219,500 | $88,800 | $130,700 |
| 2017 | $4,443 | $219,500 | $88,800 | $130,700 |
| 2016 | $4,443 | $219,500 | $88,800 | $130,700 |
| 2015 | $4,127 | $198,900 | $86,400 | $112,500 |
| 2014 | $3,990 | $198,900 | $86,400 | $112,500 |
| 2013 | $3,936 | $198,900 | $86,400 | $112,500 |
Map
- 165 Merrymount Dr
- 19 Crowfield Dr
- 550 Algonquin Dr
- 39 Merrymount Dr
- 26 Black Creek Ln
- 179 Lane 4
- 50 Lane 2
- 135 Namquid Dr
- 69 Namquid Dr
- 329 Namquid Dr
- 286 Namquid Dr
- 48 Lane 2
- 19 Benson Ave
- 43 Ferrier Dr
- 31 Todd St
- 600 Cole Farm Rd
- 90 Frontier Rd
- 417 Squantum Dr
- 15 Sarah Teft Dr
- 301 W Shore Rd Unit 19
- 439 Algonquin Dr
- 292 Merrymount Dr
- 454 Algonquin Dr
- 280 Merrymount Dr
- 268 Merrymount Dr
- 429 Algonquin Dr
- 434 Algonquin Dr
- 295 Merrymount Dr
- 258 Merrymount Dr
- 70 Rancocos Dr
- 289 Merrymount Dr
- 88 Nakomis Dr
- 269 Merrymount Dr
- 419 Algonquin Dr
- 424 Algonquin Dr
- 279 Merrymount Dr
- 75 Nakomis Dr
- 65 Rancocos Dr
- 259 Merry Mount Dr
- 259 Merrymount Dr
Ask me questions while you tour the home.