444 Chase St Winchester, VA 22601
Winchester AreaEstimated Value: $206,000 - $254,403
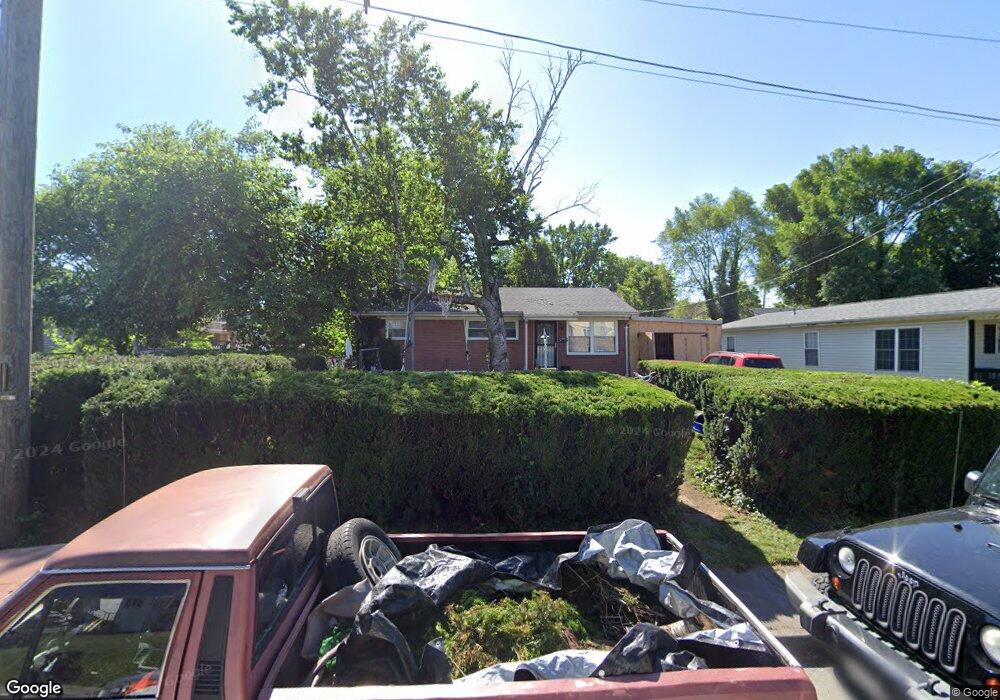
About This Home
This home is located at 444 Chase St, Winchester, VA 22601 and is currently estimated at $221,351, approximately $226 per square foot. 444 Chase St is a home located in Winchester City with nearby schools including Virginia Avenue Charlotte Dehart Elementary School, Daniel Morgan Middle School, and John Handley High School.
Ownership History
We collect this data history from publicly available records. To have your information removed, we recommend requesting removal directly through your county’s website.
Purchase Details
Home Financials for this Owner
Home Financials are based on the most recent Mortgage that was taken out on this home.Home Values in the Area
Average Home Value in this Area
Purchase History
We collect this data history from publicly available records. To have your information removed, we recommend requesting removal directly through your county’s website.
| Date | Buyer | Sale Price | Title Company |
|---|---|---|---|
| $100,000 | None Available |
Mortgage History
We collect this data history from publicly available records. To have your information removed, we recommend requesting removal directly through your county’s website.
| Date | Status | Borrower | Loan Amount |
|---|---|---|---|
| Open | $98,188 |
Tax History
We collect this data history from publicly available records. To have your information removed, we recommend requesting removal directly through your county’s website.
| Year | Tax Paid | Tax Assessment Tax Assessment Total Assessment is a certain percentage of the fair market value that is determined by local assessors to be the total taxable value of land and additions on the property. | Land | Improvement |
|---|---|---|---|---|
| 2026 | $1,464 | $184,100 | $35,000 | $149,100 |
| 2025 | $1,464 | $184,100 | $35,000 | $149,100 |
| 2024 | $1,360 | $163,900 | $35,000 | $128,900 |
| 2023 | $1,360 | $163,900 | $35,000 | $128,900 |
| 2022 | $1,118 | $120,200 | $35,000 | $85,200 |
| 2021 | $1,118 | $120,200 | $35,000 | $85,200 |
| 2020 | $938 | $100,900 | $35,000 | $65,900 |
| 2019 | $938 | $100,900 | $35,000 | $65,900 |
| 2018 | $871 | $95,700 | $29,800 | $65,900 |
| 2017 | $871 | $95,700 | $29,800 | $65,900 |
| 2016 | $766 | $84,200 | $29,800 | $54,400 |
| 2015 | $766 | $84,200 | $29,800 | $54,400 |
| 2014 | $725 | $76,300 | $29,800 | $46,500 |
Map
- 406 Highland Ave
- 321 N Kent St
- 45 and 45 1/2 Race St
- 317 N Kent St
- 446 N Loudoun St
- 317 Gray Ave
- 320 Virginia Ave
- 601 Gray Ave
- 315 National Ave
- 411-U105 N Loudoun St Unit 105
- 369 Charles St
- 593 N Kent St
- 307 1/2 E Piccadilly St
- 103 Marlow Ct
- 317 Fairview Ave
- 419 van Fossen St
- 384 National Ave
- 614 Sherlock Trace
- 623 Smithfield Ave
- 506 Fairmont Ave
Ask me questions while you tour the home.