Estimated Value: $408,863
About This Home
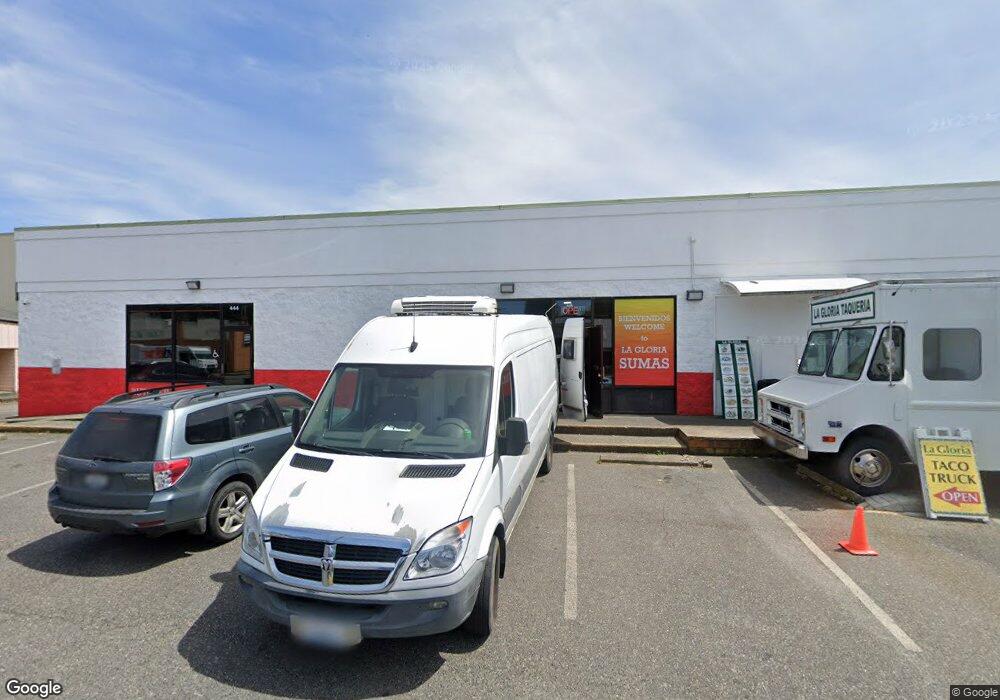
This home is located at 444 Cherry St, Sumas, WA 98295 and is currently estimated at $408,863, approximately $88 per square foot. 444 Cherry St is a home located in Whatcom County with nearby schools including Sumas Elementary School, Nooksack Elementary School, and Everson Elementary School.
Ownership History
We collect this data history from publicly available records. To have your information removed, we recommend requesting removal directly through your county’s website.
Purchase Details
Home Financials for this Owner
Home Financials are based on the most recent Mortgage that was taken out on this home.Purchase Details
Purchase Details
Home Financials for this Owner
Home Financials are based on the most recent Mortgage that was taken out on this home.Purchase History
We collect this data history from publicly available records. To have your information removed, we recommend requesting removal directly through your county’s website.
| Date | Buyer | Sale Price | Title Company |
|---|---|---|---|
| $300,000 | Chicago Title Bellingham | ||
| -- | None Available | ||
| $549,280 | Whatcom Land Title |
Mortgage History
We collect this data history from publicly available records. To have your information removed, we recommend requesting removal directly through your county’s website.
| Date | Status | Borrower | Loan Amount |
|---|---|---|---|
| Open | $200,000 | ||
| Previous Owner | $192,150 |
Tax History
We collect this data history from publicly available records. To have your information removed, we recommend requesting removal directly through your county’s website.
| Year | Tax Paid | Tax Assessment Tax Assessment Total Assessment is a certain percentage of the fair market value that is determined by local assessors to be the total taxable value of land and additions on the property. | Land | Improvement |
|---|---|---|---|---|
| 2025 | $3,633 | $383,282 | $79,168 | $304,114 |
| 2024 | $3,139 | $383,282 | $79,168 | $304,114 |
| 2023 | $3,139 | $328,089 | $53,760 | $274,329 |
| 2022 | $3,450 | $328,089 | $53,760 | $274,329 |
| 2021 | $5,358 | $292,626 | $53,760 | $238,866 |
| 2020 | $5,139 | $397,814 | $53,760 | $344,054 |
| 2019 | $4,536 | $397,814 | $53,760 | $344,054 |
| 2018 | $6,337 | $397,814 | $53,760 | $344,054 |
| 2017 | $6,103 | $426,591 | $68,541 | $358,050 |
| 2016 | $6,048 | $426,591 | $68,541 | $358,050 |
| 2015 | $5,484 | $426,591 | $68,541 | $358,050 |
| 2014 | -- | $417,000 | $67,000 | $350,000 |
| 2013 | -- | $417,000 | $67,000 | $350,000 |
Map
- 310 Second St
- 304 Sumas Ave
- 517 Lawson St
- 230 Cleveland Ave
- 319 Vancouver St
- 226 Morton St
- 232 Front St
- 0 Washington 547
- 0 Hill Rd
- 3650 E Badger Rd
- 9801 Lenhart Rd
- 5419 Hillview Rd
- 4135 Kamphouse Dr
- 5326 Reese Hill Rd
- 0 Clearbrook Rd
- 4315 Nordum Rd
- 2654 Halverstick Rd
- 48 XX Reese Hill Rd
- 9007 Van Buren Rd
- 5450 Reese Hill Rd
Ask me questions while you tour the home.