445 E Cecil St Neenah, WI 54956
Estimated Value: $258,000 - $301,389
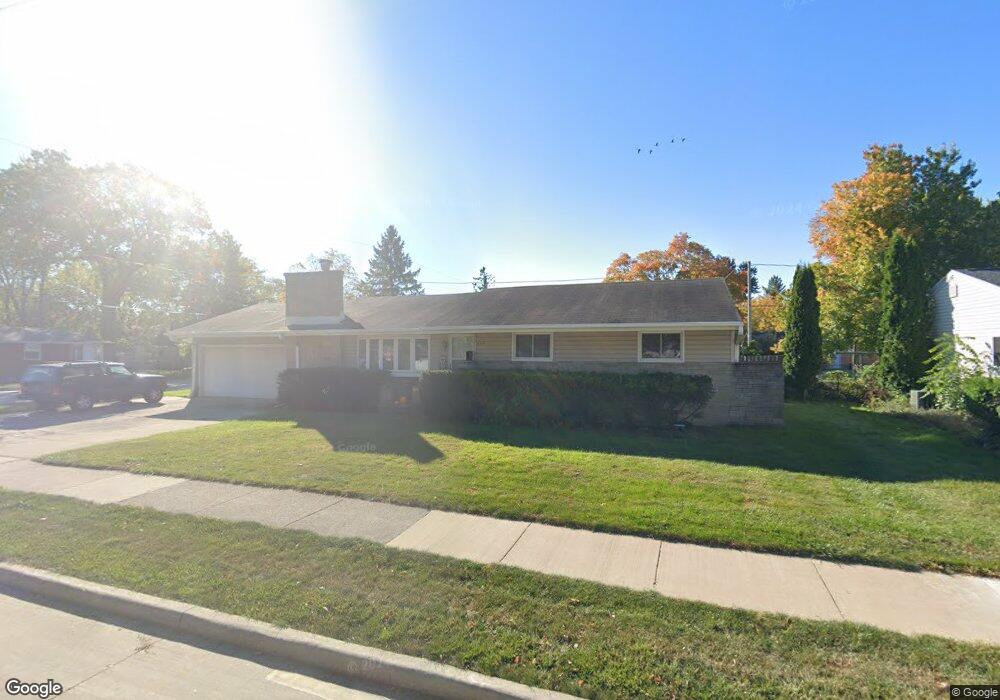
About This Home
This home is located at 445 E Cecil St, Neenah, WI 54956 and is currently estimated at $277,847, approximately $206 per square foot. 445 E Cecil St is a home located in Winnebago County with nearby schools including Horace Mann Middle School, Horace Mann Elementary School, and Neenah Middle School.
Ownership History
We collect this data history from publicly available records. To have your information removed, we recommend requesting removal directly through your county’s website.
Purchase Details
Home Financials for this Owner
Home Financials are based on the most recent Mortgage that was taken out on this home.Home Values in the Area
Average Home Value in this Area
Purchase History
We collect this data history from publicly available records. To have your information removed, we recommend requesting removal directly through your county’s website.
| Date | Buyer | Sale Price | Title Company |
|---|---|---|---|
| $138,000 | None Available |
Mortgage History
We collect this data history from publicly available records. To have your information removed, we recommend requesting removal directly through your county’s website.
| Date | Status | Borrower | Loan Amount |
|---|---|---|---|
| Open | $141,000 |
Tax History
We collect this data history from publicly available records. To have your information removed, we recommend requesting removal directly through your county’s website.
| Year | Tax Paid | Tax Assessment Tax Assessment Total Assessment is a certain percentage of the fair market value that is determined by local assessors to be the total taxable value of land and additions on the property. | Land | Improvement |
|---|---|---|---|---|
| 2025 | -- | $212,500 | $34,000 | $178,500 |
| 2024 | $3,176 | $212,500 | $34,000 | $178,500 |
| 2023 | $3,176 | $212,500 | $34,000 | $178,500 |
| 2022 | $3,300 | $167,300 | $29,000 | $138,300 |
| 2021 | $5,956 | $167,300 | $29,000 | $138,300 |
| 2020 | $6,154 | $167,300 | $29,000 | $138,300 |
| 2019 | $6,058 | $167,300 | $29,000 | $138,300 |
| 2018 | $5,913 | $131,600 | $28,200 | $103,400 |
| 2017 | $5,410 | $131,600 | $28,200 | $103,400 |
| 2016 | $2,906 | $131,600 | $28,200 | $103,400 |
| 2015 | $2,930 | $131,600 | $28,200 | $103,400 |
| 2014 | $2,957 | $131,600 | $28,200 | $103,400 |
| 2013 | $3,105 | $131,600 | $28,200 | $103,400 |
Map
- 778 Elm St
- 663 Reed St
- 715 Reed St
- 711 Reed St
- 707 Reed St
- 508 Winnebago Heights
- 659 Reed St
- 655 Reed St
- 651 Reed St
- 579 Oak St
- 142 W Peckham St
- 207 Crescent Dr
- 651 Winnebago Heights
- 715 Division St
- 405 E Columbian Ave
- 628 Roosevelt St
- 203 Cedar St
- 708 Yorkshire Rd
- 402 E Wisconsin Ave
- 643 Jackson St
Ask me questions while you tour the home.