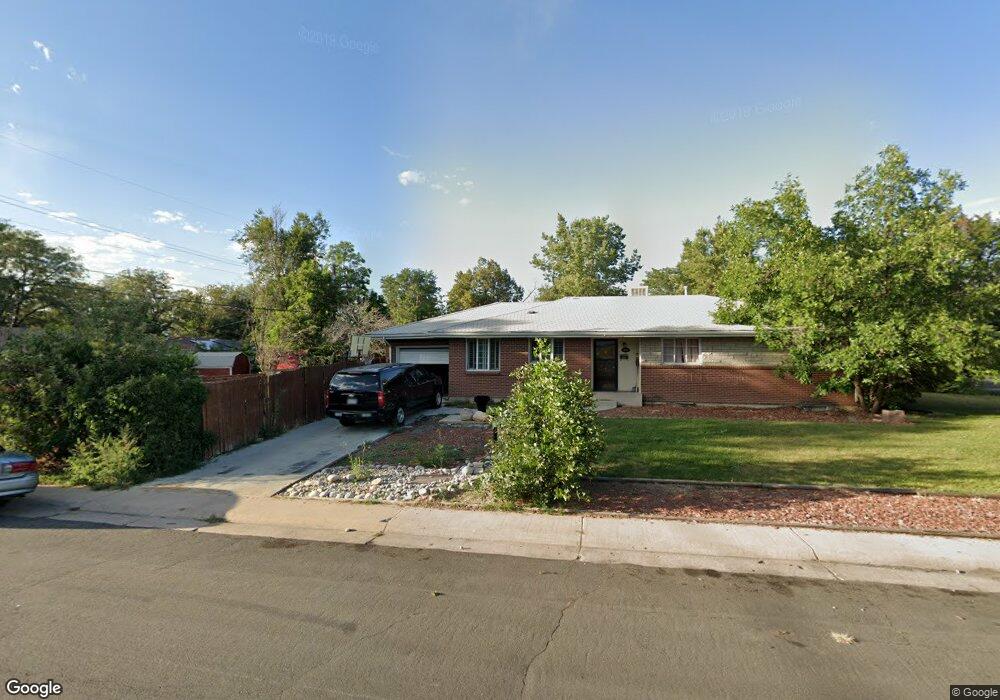
445 Moline St Aurora, CO 80010
Highland Park NeighborhoodEstimated Value: $425,056 - $502,000
3
Beds
2
Baths
1,403
Sq Ft
$326/Sq Ft
Est. Value
About This Home
This home is located at 445 Moline St, Aurora, CO 80010 and is currently estimated at $457,514, approximately $326 per square foot. 445 Moline St is a home located in Arapahoe County with nearby schools including Lansing Elementary Community School, Aurora Hills Middle School, and Aurora Central High School.
Ownership History
Date
Name
Owned For
Owner Type
Purchase Details
Closed on
Dec 21, 2005
Sold by
Hill Richard H and Hill La Vonne C
Bought by
Romo Everardo A and Chavez Jose J
Current Estimated Value
Home Financials for this Owner
Home Financials are based on the most recent Mortgage that was taken out on this home.
Original Mortgage
$204,786
Outstanding Balance
$112,164
Interest Rate
6.23%
Mortgage Type
FHA
Estimated Equity
$345,350
Purchase Details
Closed on
Jul 4, 1776
Bought by
Conversion Arapco
Create a Home Valuation Report for This Property
The Home Valuation Report is an in-depth analysis detailing your home's value as well as a comparison with similar homes in the area
Home Values in the Area
Average Home Value in this Area
Purchase History
| Date | Buyer | Sale Price | Title Company |
|---|---|---|---|
| Romo Everardo A | $208,000 | Chicago Title Co | |
| Conversion Arapco | -- | -- |
Source: Public Records
Mortgage History
| Date | Status | Borrower | Loan Amount |
|---|---|---|---|
| Open | Romo Everardo A | $204,786 |
Source: Public Records
Tax History
| Year | Tax Paid | Tax Assessment Tax Assessment Total Assessment is a certain percentage of the fair market value that is determined by local assessors to be the total taxable value of land and additions on the property. | Land | Improvement |
|---|---|---|---|---|
| 2025 | $2,932 | $28,438 | -- | -- |
| 2024 | $2,844 | $30,599 | -- | -- |
| 2023 | $2,844 | $30,599 | $0 | $0 |
| 2022 | $2,290 | $22,810 | $0 | $0 |
| 2021 | $2,364 | $22,810 | $0 | $0 |
| 2020 | $2,427 | $23,309 | $0 | $0 |
| 2019 | $2,414 | $23,309 | $0 | $0 |
| 2018 | $1,991 | $18,828 | $0 | $0 |
| 2017 | $1,732 | $18,828 | $0 | $0 |
| 2016 | $1,505 | $16,016 | $0 | $0 |
| 2015 | $1,452 | $16,016 | $0 | $0 |
| 2014 | $897 | $9,528 | $0 | $0 |
| 2013 | -- | $11,360 | $0 | $0 |
Source: Public Records
Map
Nearby Homes
- 429 Newark St
- 11408 E 7th Ave
- 11520 E 2nd Ave
- 11038 E 4th Way
- 11550 E 2nd Ave
- 740 Moline St
- 745 Lima St
- 740 Newark St
- 11612 Del Mar Pkwy
- 765 Moline St
- 800 Nile St
- 64 Macon St
- 80 Lansing St Unit 80
- 820 Newark St
- 10633 E 6th Place
- 11413 E Ellsworth Place
- 92 Newark St Unit A
- 11718 E Canal Dr
- 775 Joliet St
- 855 Newark St
Your Personal Tour Guide
Ask me questions while you tour the home.