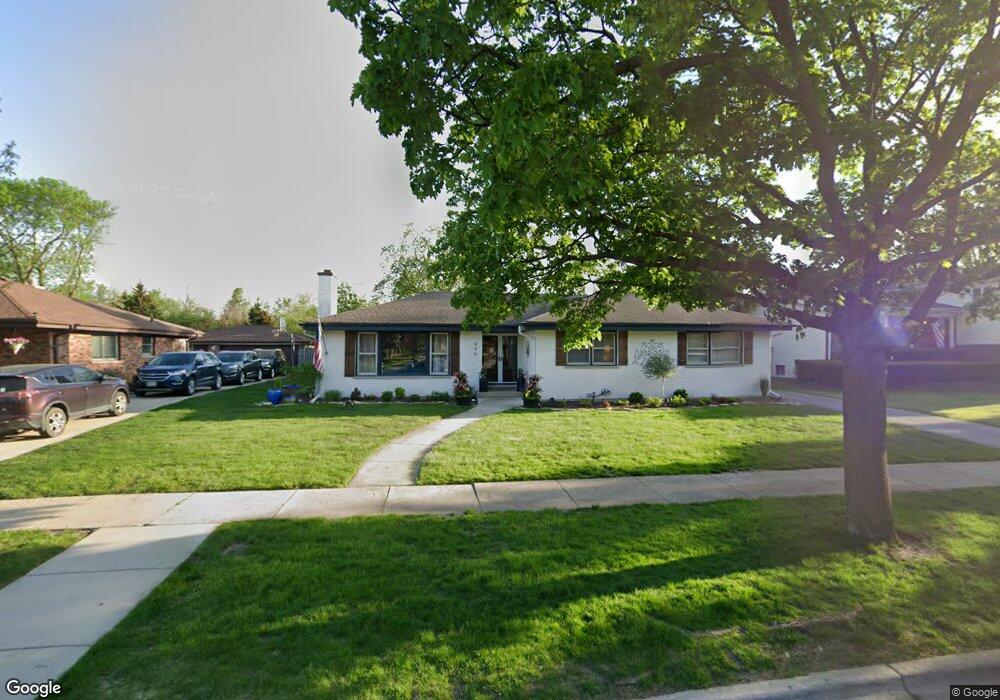
446 E Allison St Elmhurst, IL 60126
Elmhurst AreaEstimated Value: $716,000 - $907,000
About This Home
This home is located at 446 E Allison St, Elmhurst, IL 60126 and is currently estimated at $810,050, approximately $392 per square foot. 446 E Allison St is a home located in DuPage County with nearby schools including Jefferson Elementary School, Sandburg Middle School, and Bryan Middle School.
Ownership History
We collect this data history from publicly available records. To have your information removed, we recommend requesting removal directly through your county’s website.
Purchase Details
Home Financials for this Owner
Home Financials are based on the most recent Mortgage that was taken out on this home.Purchase Details
Home Financials for this Owner
Home Financials are based on the most recent Mortgage that was taken out on this home.Home Values in the Area
Average Home Value in this Area
Purchase History
We collect this data history from publicly available records. To have your information removed, we recommend requesting removal directly through your county’s website.
| Date | Buyer | Sale Price | Title Company |
|---|---|---|---|
| $425,000 | Attorneys Title Guaranty Fun | ||
| $372,500 | -- |
Mortgage History
We collect this data history from publicly available records. To have your information removed, we recommend requesting removal directly through your county’s website.
| Date | Status | Borrower | Loan Amount |
|---|---|---|---|
| Open | $152,500 | ||
| Open | $375,000 | ||
| Closed | $346,346 | ||
| Closed | $359,177 | ||
| Closed | $340,000 | ||
| Previous Owner | $298,000 | ||
| Previous Owner | $150,000 |
Tax History
We collect this data history from publicly available records. To have your information removed, we recommend requesting removal directly through your county’s website.
| Year | Tax Paid | Tax Assessment Tax Assessment Total Assessment is a certain percentage of the fair market value that is determined by local assessors to be the total taxable value of land and additions on the property. | Land | Improvement |
|---|---|---|---|---|
| 2024 | $11,583 | $200,199 | $124,815 | $75,384 |
| 2023 | $10,753 | $185,130 | $115,420 | $69,710 |
| 2022 | $10,427 | $177,960 | $110,950 | $67,010 |
| 2021 | $10,169 | $173,530 | $108,190 | $65,340 |
| 2020 | $9,776 | $169,730 | $105,820 | $63,910 |
| 2019 | $9,570 | $161,370 | $100,610 | $60,760 |
| 2018 | $9,904 | $165,870 | $95,240 | $70,630 |
| 2017 | $9,689 | $158,060 | $90,760 | $67,300 |
| 2016 | $9,486 | $148,900 | $85,500 | $63,400 |
| 2015 | $9,393 | $138,710 | $79,650 | $59,060 |
| 2014 | $10,703 | $144,880 | $63,790 | $81,090 |
| 2013 | $10,585 | $146,920 | $64,690 | $82,230 |
Map
- 421 E Barclay Ct
- 675 S Edgewood Ave
- 495 E Park Manor Ct
- 607 S Cedar Ave
- 605 S Fern Ave
- 798 S Linden Ave
- 575 S Fern Ave
- 291 E Wilson St
- 274 E Crescent Ave
- 845 S Colfax Ave
- 551 S Poplar Ave
- 441 E South St
- 515 S Parkview Ave
- 225 E Wilson St
- 835 S Cambridge Ave
- 738 S Kearsage Ave
- 459 E Ridge Ave
- 837 S Kearsage Ave
- 909 S Cambridge Ave
- 418 E End Ave
- 452 E Allison St
- 440 E Allison St
- 434 E Allison St
- 458 E Allison St
- 685 S Stratford Ave
- 428 E Allison St
- 462 E Allison St
- 437 E Allison St
- 425 E Barclay Ct
- 459 E Allison St
- 424 E Allison St
- 674 S Stratford Ave
- 423 E Barclay Ct
- 470 E Allison St
- 679 S Stratford Ave
- 675 S Hillcrest Ave
- 427 E Barclay Ct
- 1951 Stratford Ave
- 692 S Edgewood Ave
- 668 S Stratford Ave Unit 2
Ask me questions while you tour the home.